Data analysis built for real estate appraisers
Available now — $69.95 per user, per month. 30-day free trial.
For residential appraisers, commercial appraisers, and assessors: load your own MLS export, measure every adjustment against your own market, and hand the reviewer the charts.
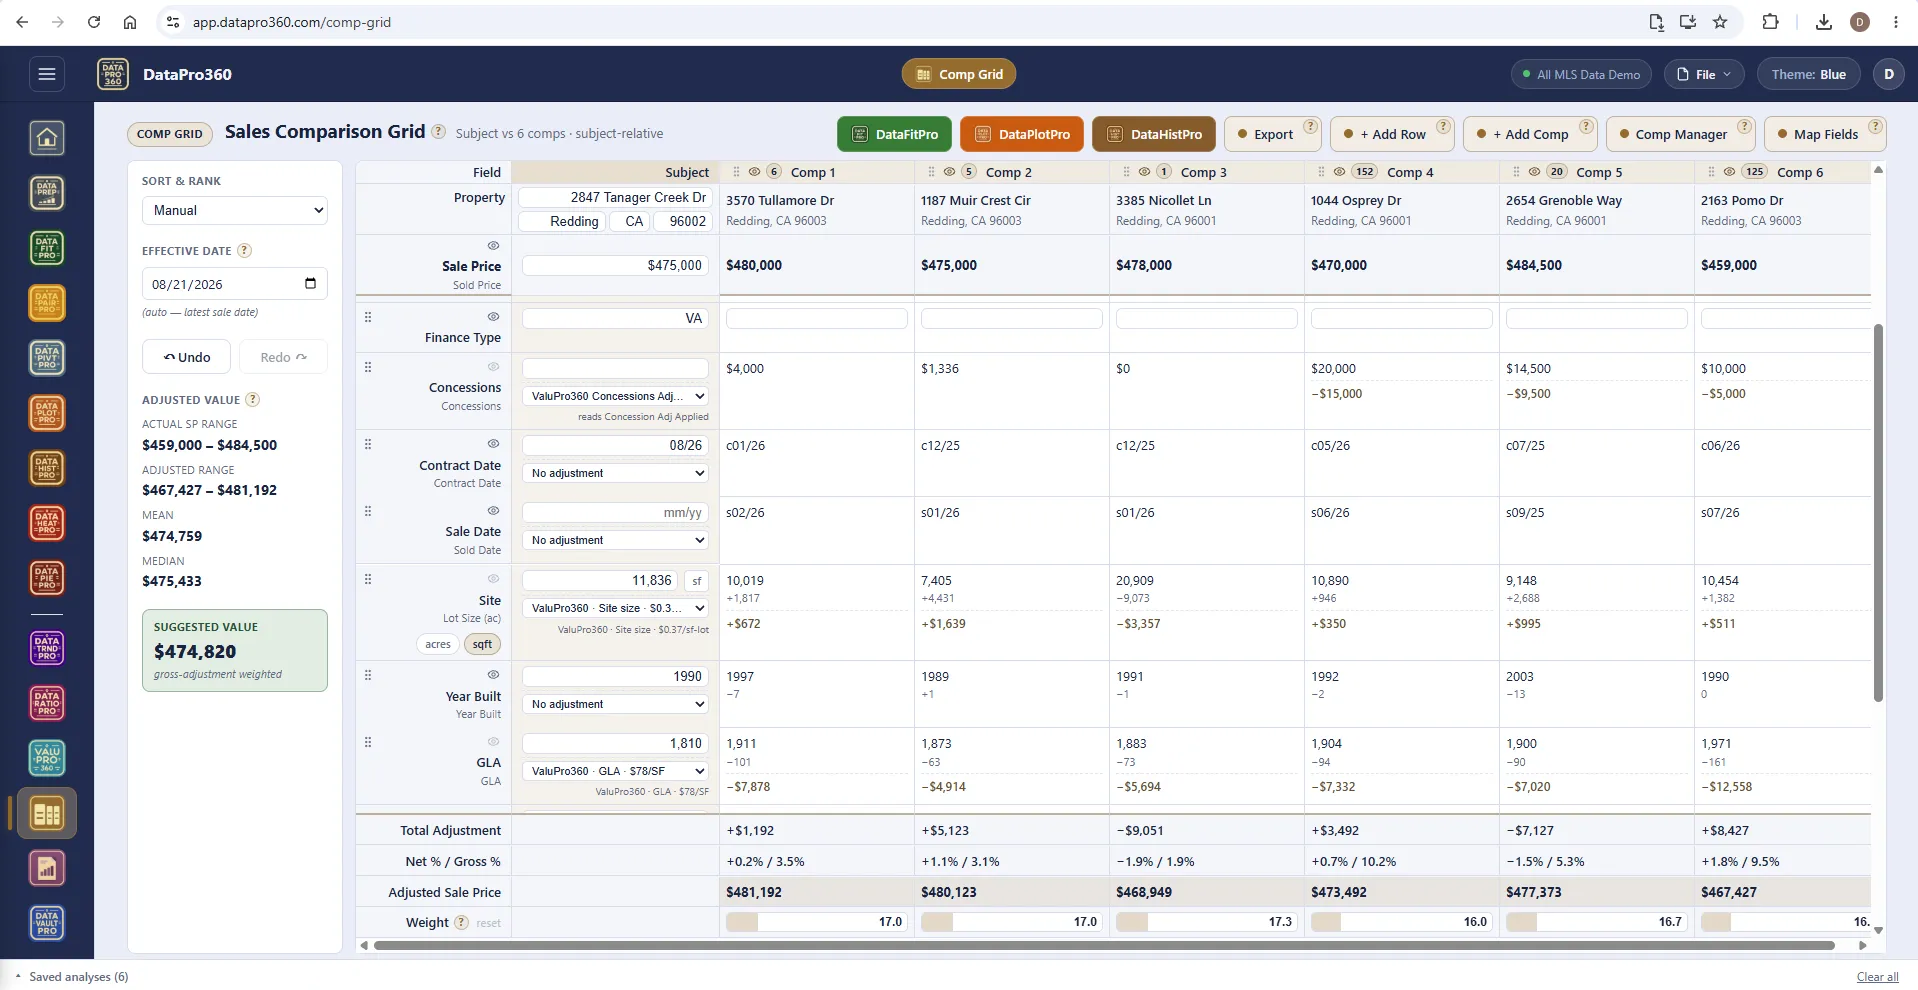
Your form software writes the report. DataPro360 proves the numbers in it.
Built for residential and commercial appraisers and assessors: load your MLS export, measure time, site size, GLA, and every other adjustment against your own market data, and get the charts and commentary that back them up.
Carry it through to a full comp grid and a finished Word or PDF report, or take the exhibits into whatever form platform you already use. Your data never leaves your machine.
- 15
- analysis surfaces over one loaded dataset
- 500+
- help entries, behind the ? on every screen
- 3
- themes — Blue, Light, Dark
- Word · PDF
- finished report out the other end
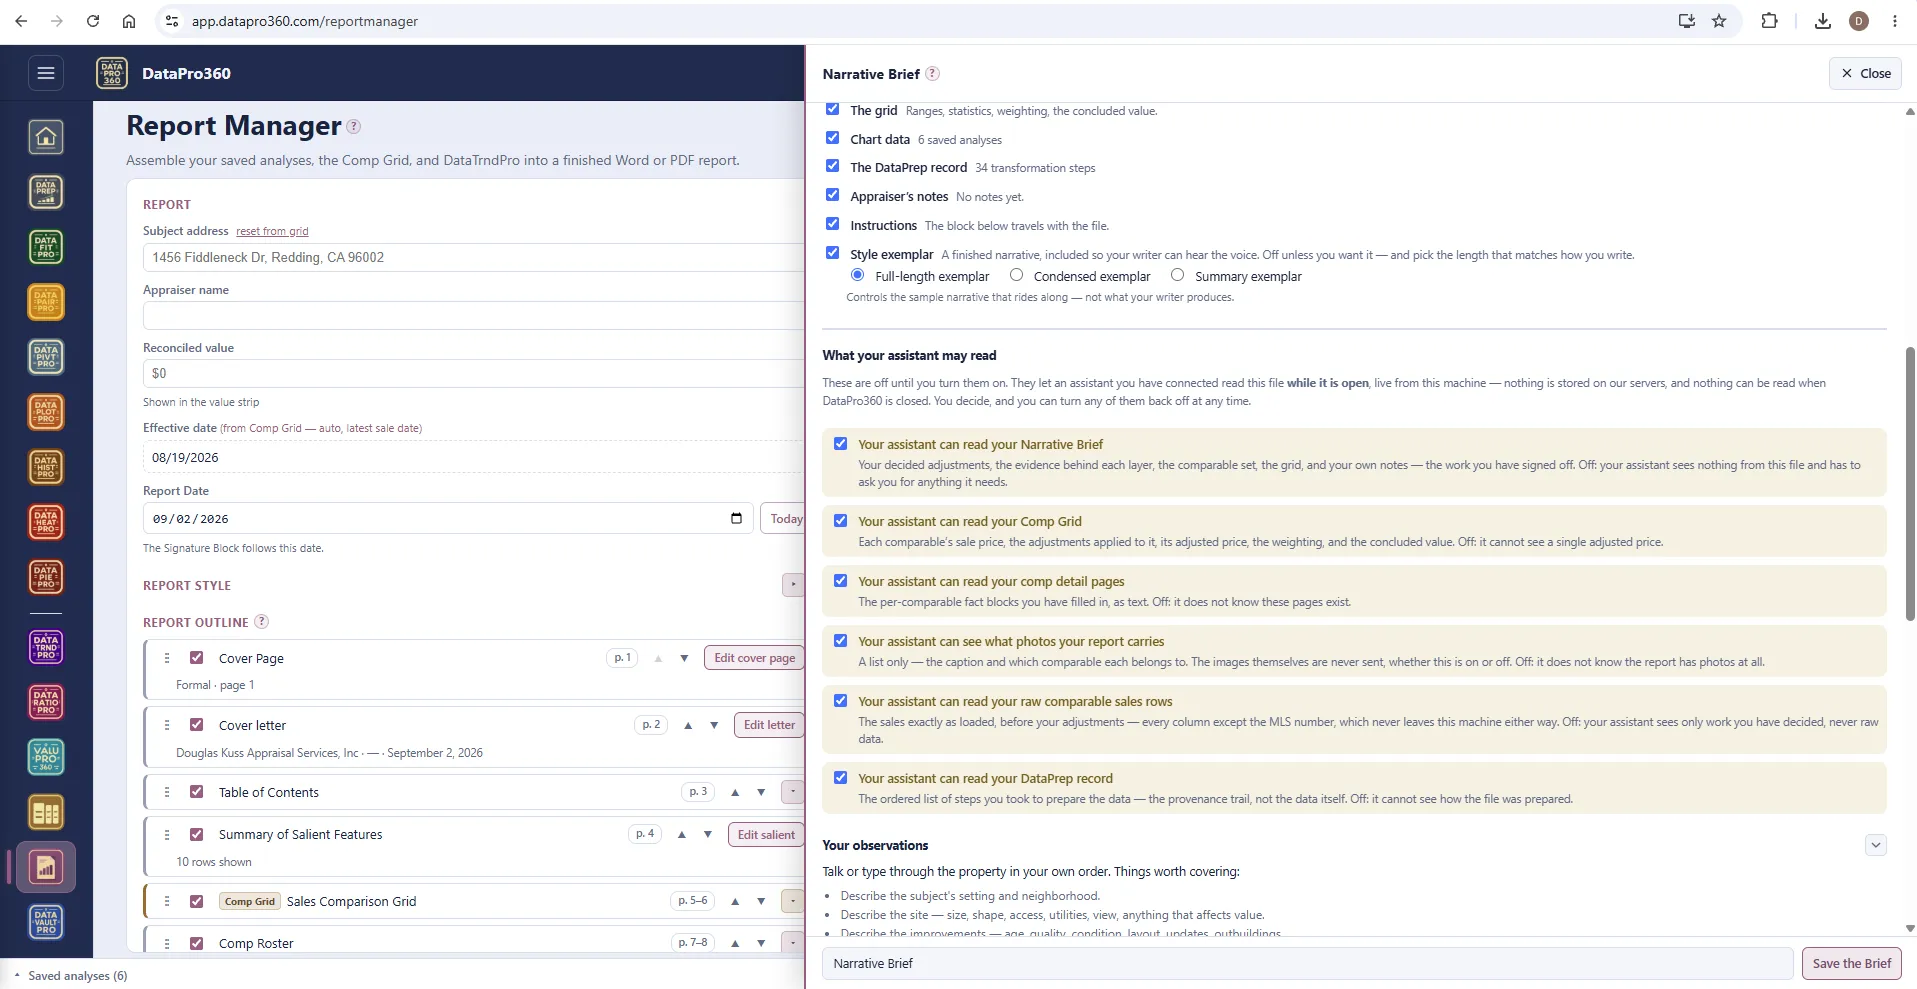
Connected assistants
Bring your own assistant. It reads what you switch on.
DataPro360 has no AI of its own. It has a connection for the one you already use. Claude and ChatGPT connect to DataPro360 today through MCP, an open standard for connecting assistants to software — under your own account with that provider, and only after you sign in and approve it.
It reads the parts of your open file you switch on. The Narrative Brief, the comp grid, the comparable sales, the comp pages, the photo list, the prep record — each has its own switch in the Brief. Every one is off until you turn it on, per file, and nothing is read once the file is closed.
It proposes text. You accept it. Ask your assistant to draft a market-conditions paragraph from your Brief and send it over. It lands on a review shelf in your Text Library. Accept it or discard it. It cannot write into a report.
It can stage comparable sales into your account. Pull sales through the MLS connection you already have in the assistant and hand them to DataPro360. They wait in your import queue until you load them. Nothing is analyzed on the way in.
The assistant also reads DataPro360's own documentation — twenty-one documents describing every tool — so it answers how-do-I questions from the program's manual, not from guessing. What it does with what it reads is governed by your provider's terms, not ours.
Data locality
Your data stays yours.
The ruled sentence — your data never leaves your machine — describes the analysis. Here is exactly what that means.
-
The analysis runs on your computer.
It runs in your browser, on your own machine. Your sales file loads into the page and the measuring happens there — the rows are not uploaded to a server to be analyzed.
-
Saved work lives in files you keep.
Your assignments are .dp360 files on your own disk. DataPro360 is not a portal holding your comp database.
-
The narrative is not written by an AI.
It is written by a deterministic engine from the analysis itself. No AI service sees your file unless you connect one and switch on a read — and then it sees only that, only while the file is open.
Your account, sign-in and billing run on standard web infrastructure, as any subscription does — and optional cloud backup mirrors only the folder you designate. The claim is about your analysis data.
The workflow
From MLS export to finished report.
Five steps. Each one leaves evidence the next one reads.
- Step 1
Load your MLS export
An Excel or CSV export from your MLS — or sales pulled from your own DataVaultPro.
- Step 2
Prep the data
Map the fields, scrub, filter, recode, combine — one shared log every tool reads.
- Step 3
Measure every adjustment
ValuPro360 walks each layer off charted evidence; the free-form tools prove the rest.
- Step 4
Build the grid
Subject and comps with the decided adjustments applied, recomputing as you work.
- Step 5
Assemble the report
Cover to signature, every saved analysis in place — exported as Word or PDF.


Solve it once. Use it all year.
The Prep Recipe. Every step you took to prepare an export — the scrub, the filters, the recodes, the derived columns — in order, saved. Next month's file from the same MLS: load it, apply the recipe, and every step replays exactly as you did it the first time, on the record where a reviewer can read it.
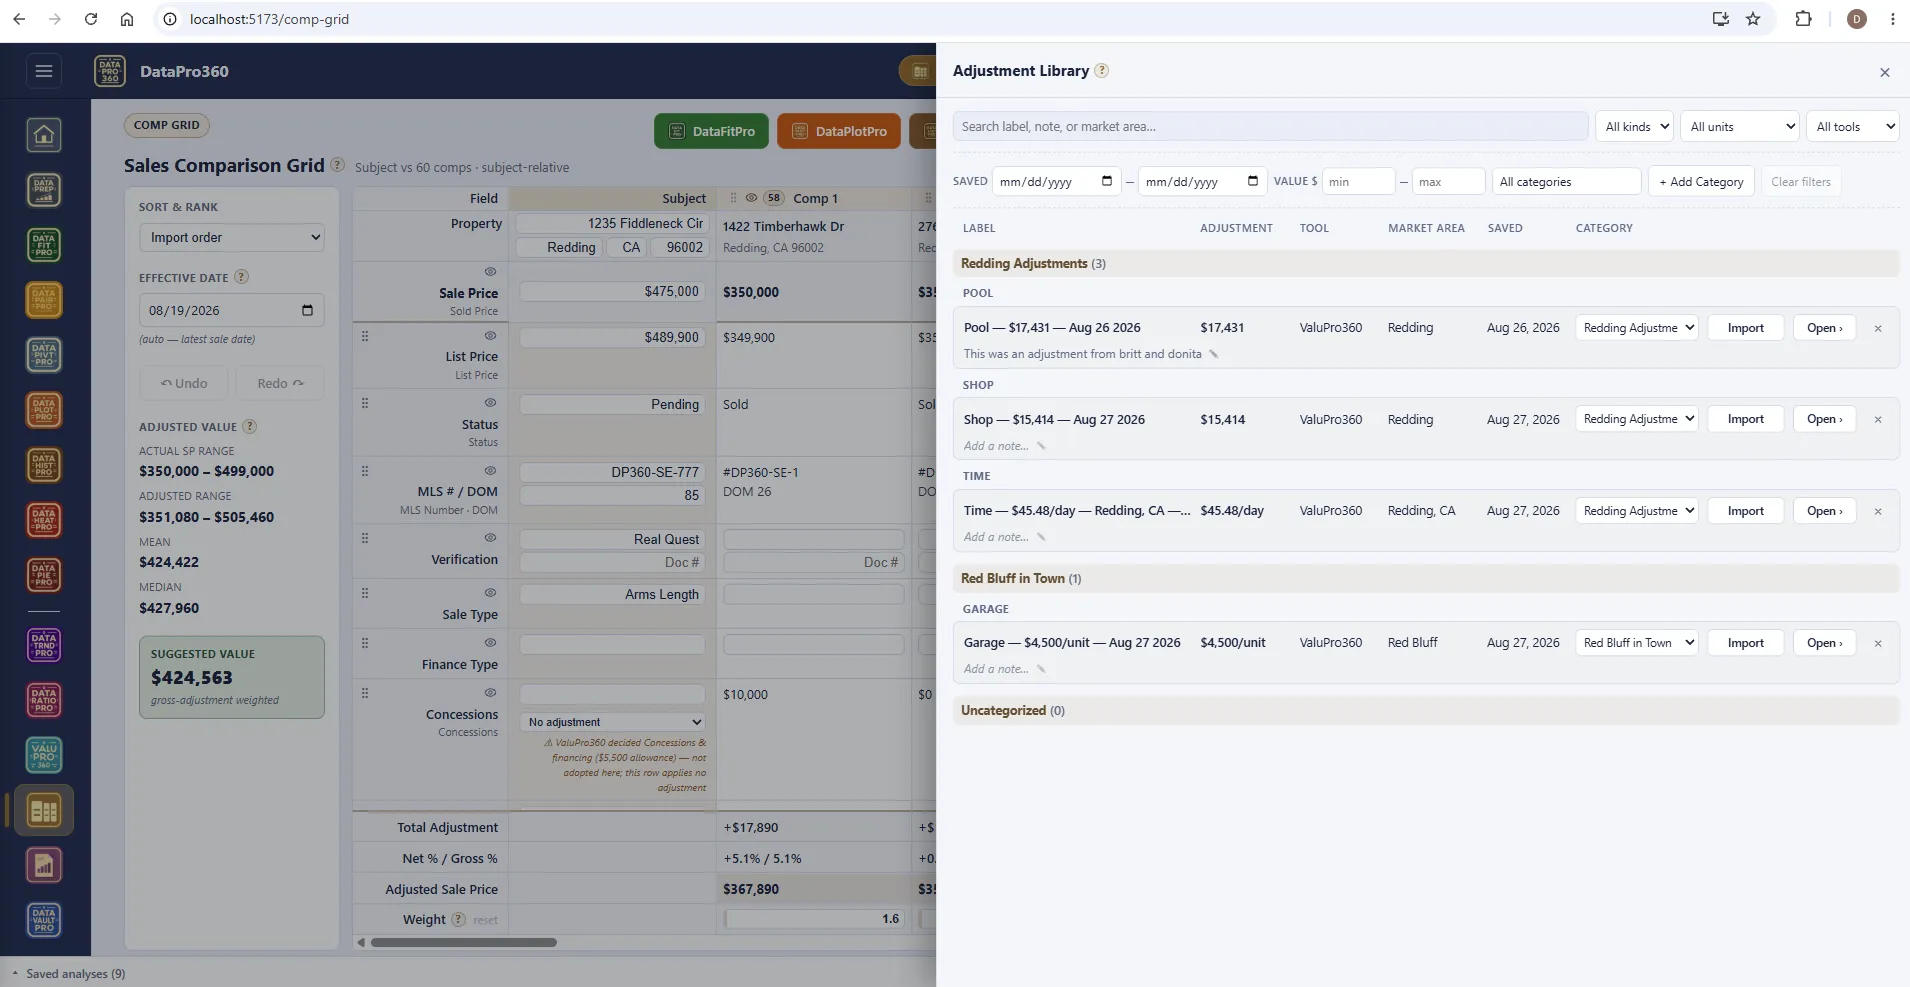
The Adjustment Library.
The Adjustment Library is a shelf of rates you have already supported, kept outside any one assignment. Save a rate the day you derive it and it comes back whole — the figure, the method, the sales behind it, the charts, and the paragraph that explains where it came from.
The snapshot never changes. Saving freezes the figure with its unit and basis, the method that produced it, how many sales it came from, their price range and date range, the effective date, and every table, chart and narrative paragraph the station's report section would have printed. Load a different file next year and the entry reads exactly as it did the day you saved it.
It lands in the report as support, not as a number. Import an entry and it arrives as a section of its own adjustment kind, carrying its exhibits and a one-sentence source statement — how many sales, which market area, which dates. You decide what prints.
The files are yours. Entries live as files in a folder on your own machine that you choose. The program reads and writes that folder and nothing else.
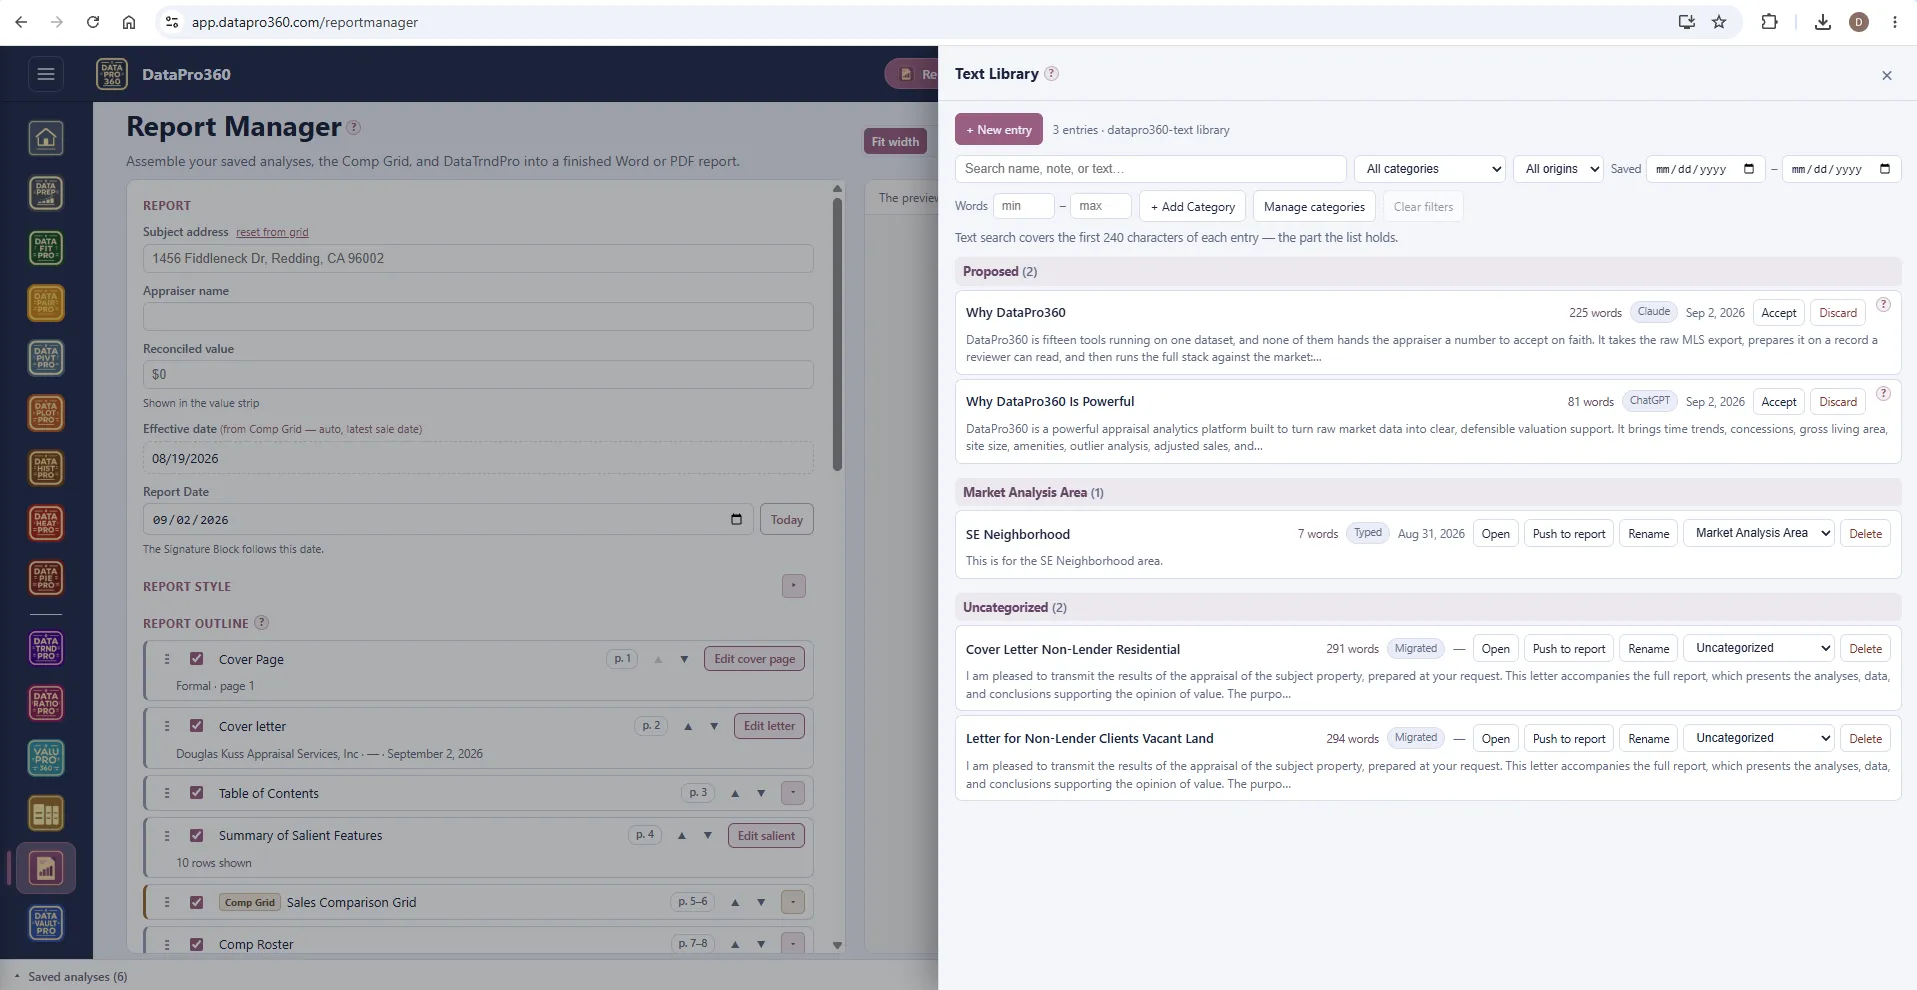
The Text Library. The same shelf, for prose. Neighborhood descriptions, market paragraphs, cover letters, the certification language you use every time — typed, spoken, saved from any field in the report, or proposed by a connected assistant. Push an entry into any text section of the report, or import it into any prose field. Categories are yours to make.
The program
Fifteen surfaces over one loaded dataset.
Load a file once and every tool reads it. Pick the one the question needs — the guided method for the adjustments, the free-form tools for everything else, the grid and the report at the end.
15 tools, one subscription
Get data in
Load an MLS export, or keep your own sales in a vault you control.

Prove the adjustment
The guided method and nine free-form tools, all reading the same loaded dataset.- ValuPro360 The guided layered method — every adjustment off its charted evidence.
- DataTrndPro Market conditions — trend prices over time to derive the time adjustment.
- DataRatioPro Assessment ratio studies — distribution, statistics, and compliance.
- DataFitPro Regressions and trends, linear and polynomial, with a narrative from the fit.
- DataPairPro Paired comparisons — isolate one variable from matched pairs of rows.
- DataHistPro Distributions — histograms of any field to see spread and outliers.
- DataPlotPro Box plots — distribution summaries of any numeric field.
- DataHeatPro Correlation heat maps of the variables you choose, by sign and strength.
- DataPivtPro Pivot and cross-tabulate — summarize the data across categories.
- DataPiePro Composition — share/pie breakdowns of categorical makeup.


Build the report
The reconciliation grid, the report assembler, and the business side.


Glass box, not black box
Every adjustment is charted evidence.
A reviewer can ask how you got the number. DataPro360 is built so the answer is already on the page — the methods, the rows they read, and the spread between them.
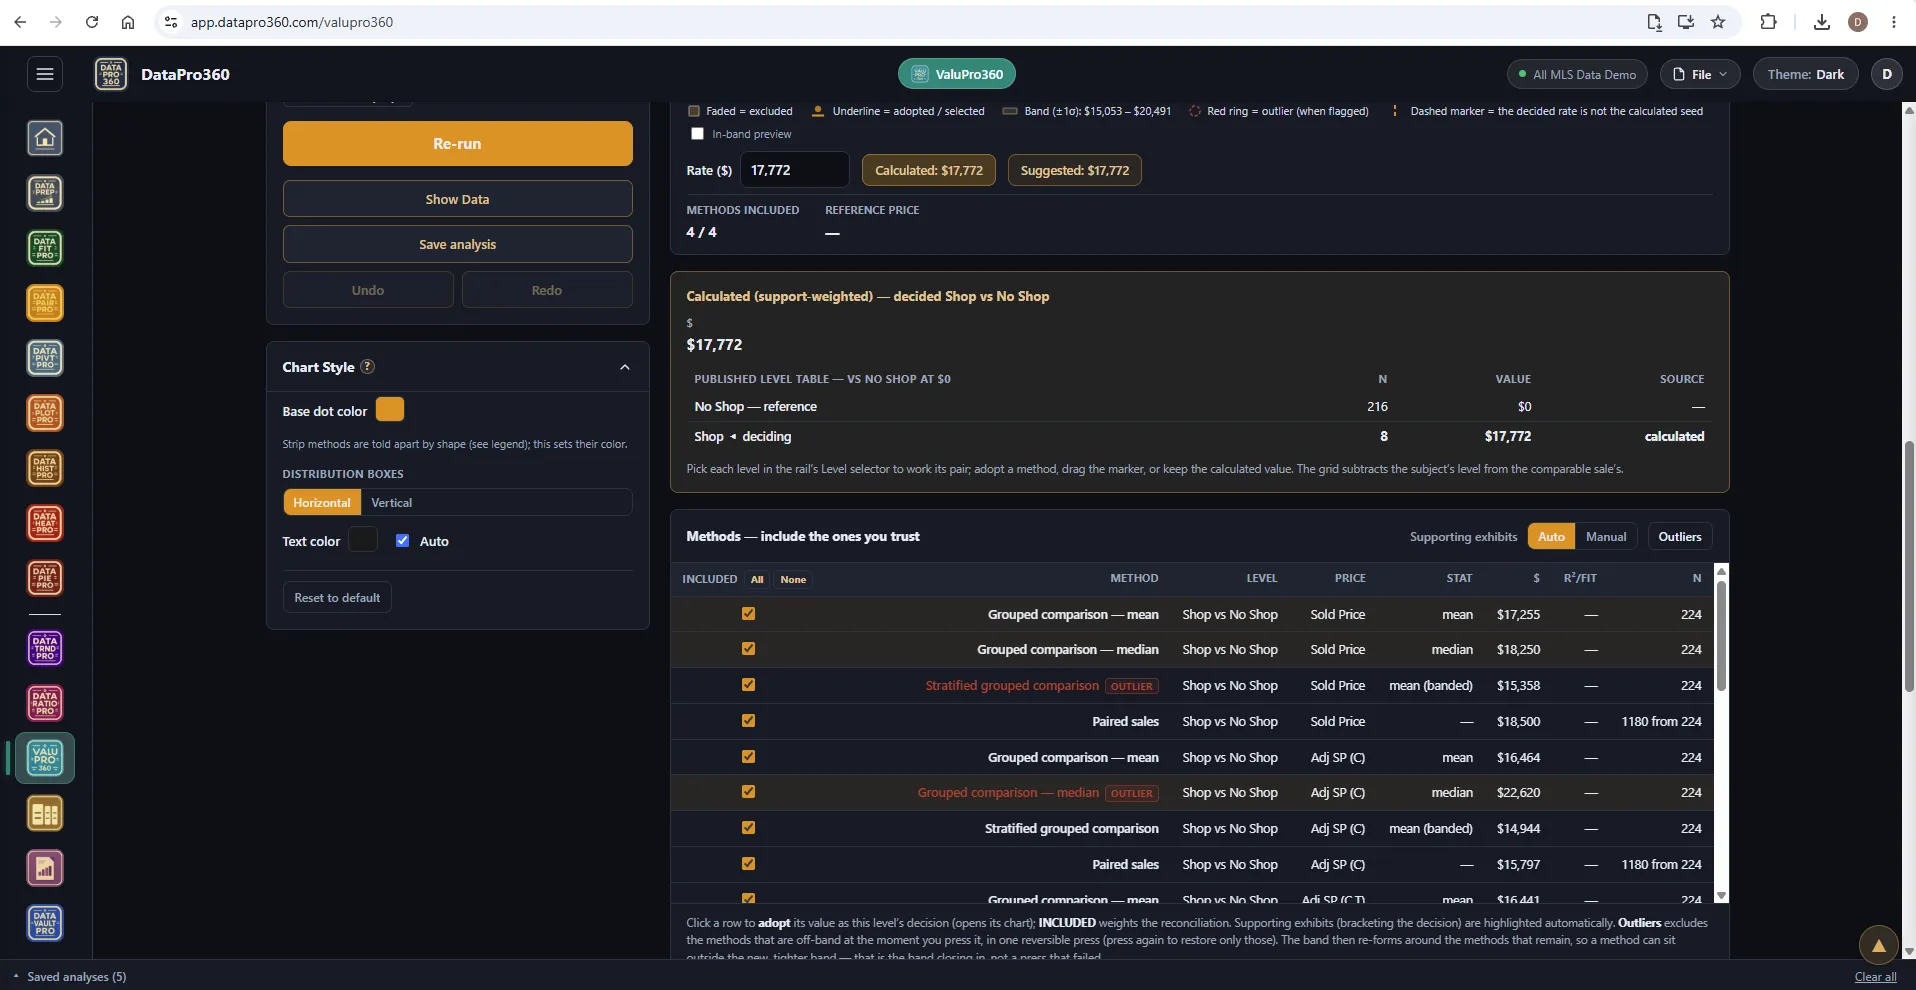
Every method, on the table.
For each layer, DataPro360 runs every method that fits the data — grouped comparisons, paired sales, stratified means, regressions — and lists each one with its n, its statistic, and its result. Outliers are flagged, not hidden. You choose which methods to trust and the rate you adopt; the program does the measuring.
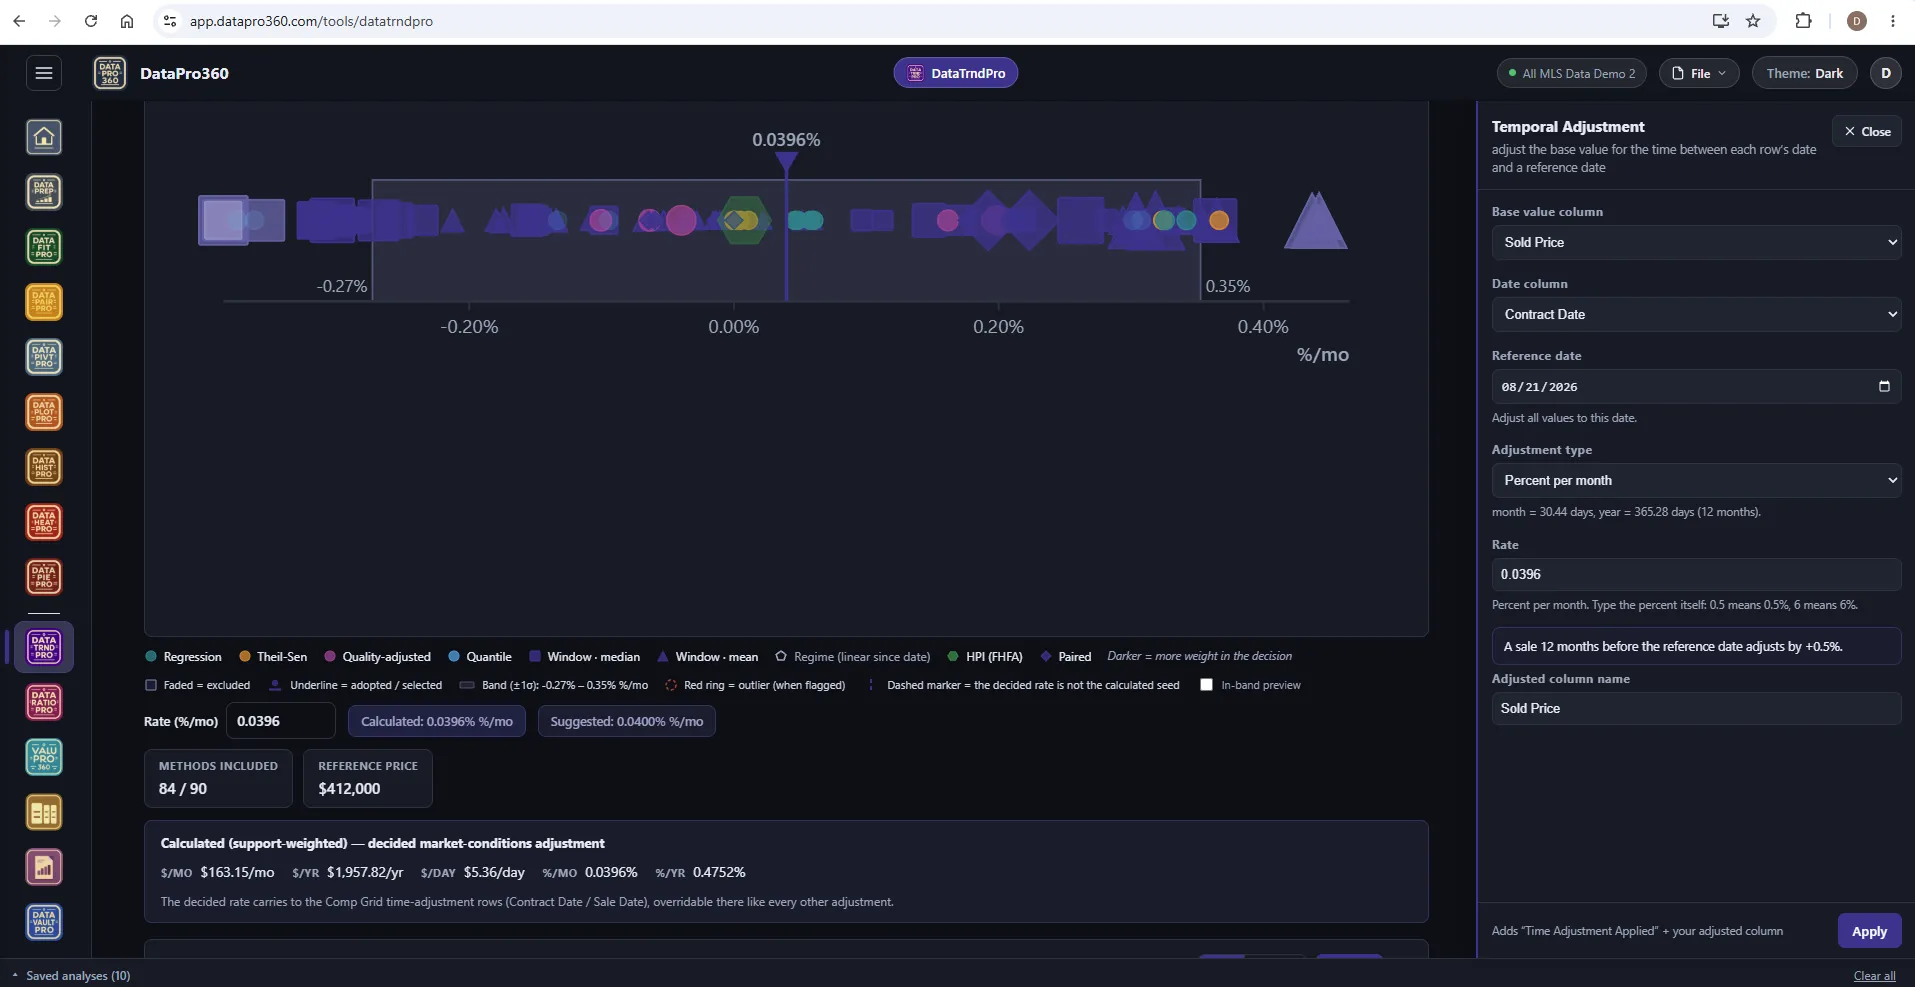
Convergence is the proof.
The methods land on a common scale. Where they cluster is the evidence for the rate; the width of the band is an honest statement of how certain it is. The decided rate carries to the Comp Grid, where it can be overridden like any other adjustment — and every method is reproducible from the same closed sales.
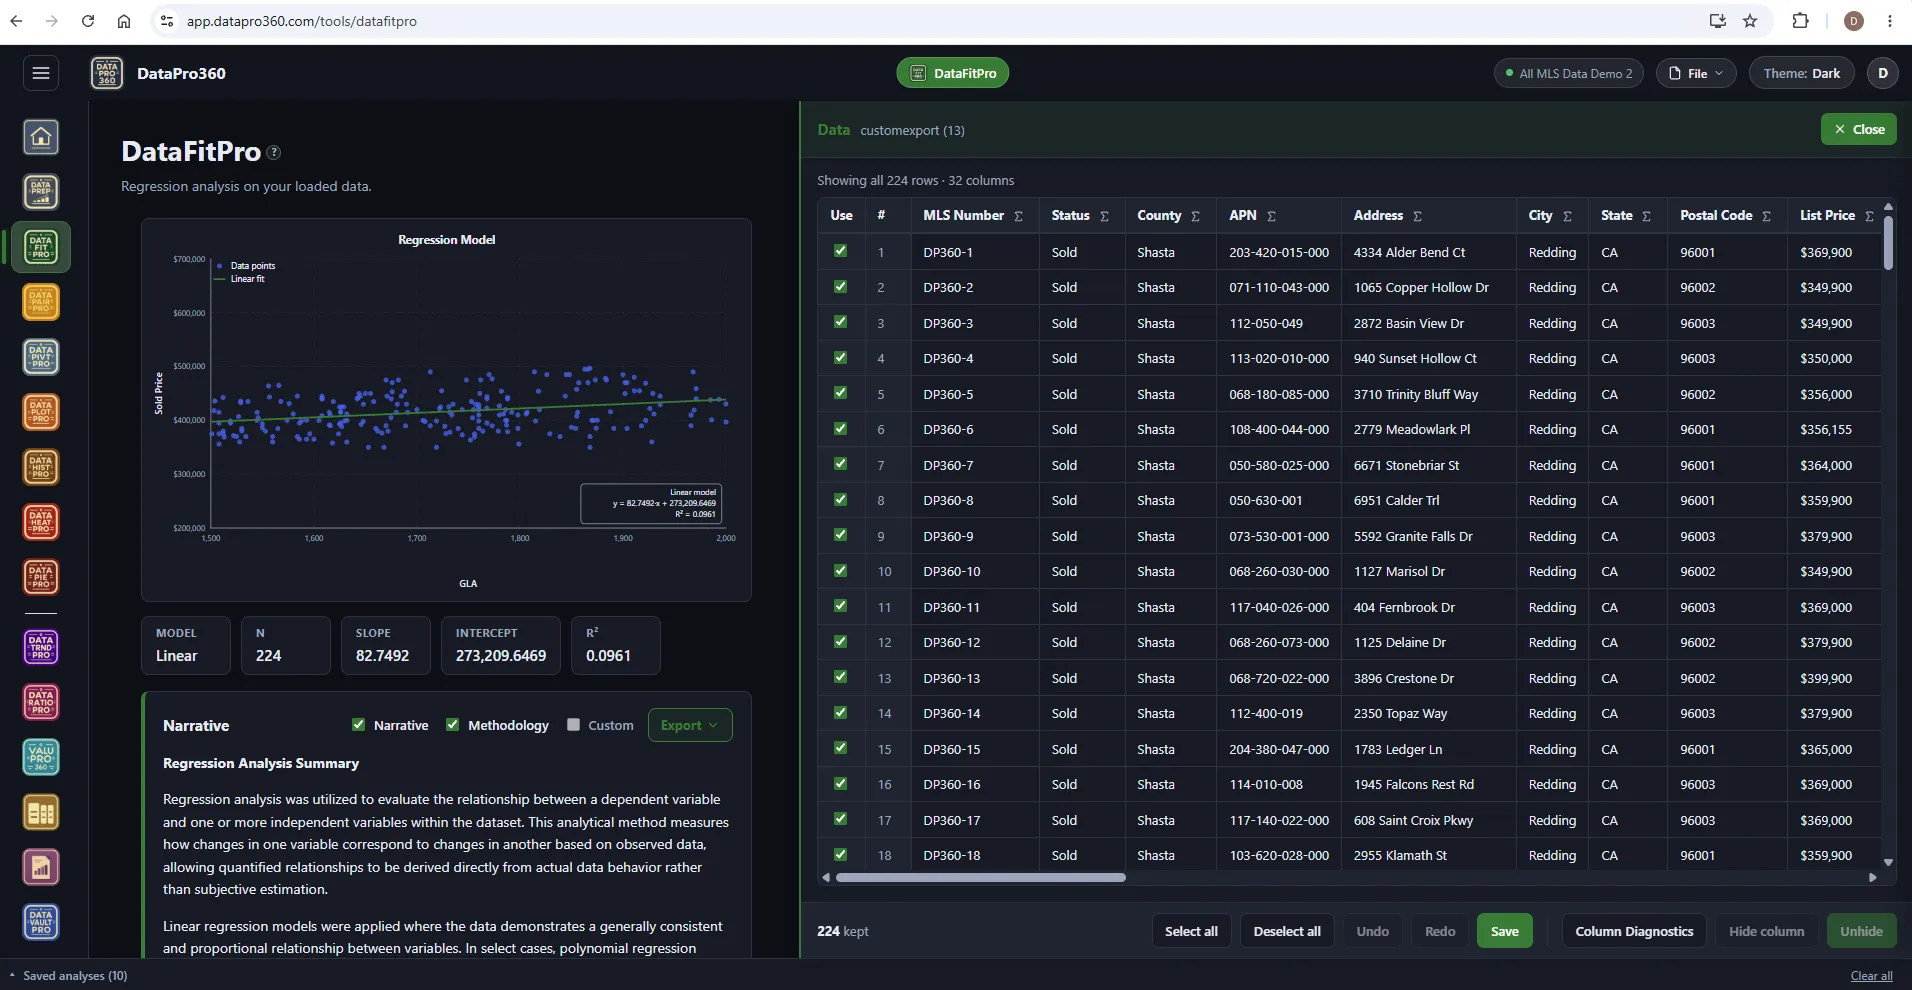
Reproducible, and written down.
Show Data opens the rows behind any chart. Save an analysis and it carries into the report with its inputs. The narrative is written from the fit itself — a deterministic engine, never a language model — so it restates what the analysis found and nothing else. DataPro360 has no AI of its own; if you connect an assistant, it reads only what you switch on.
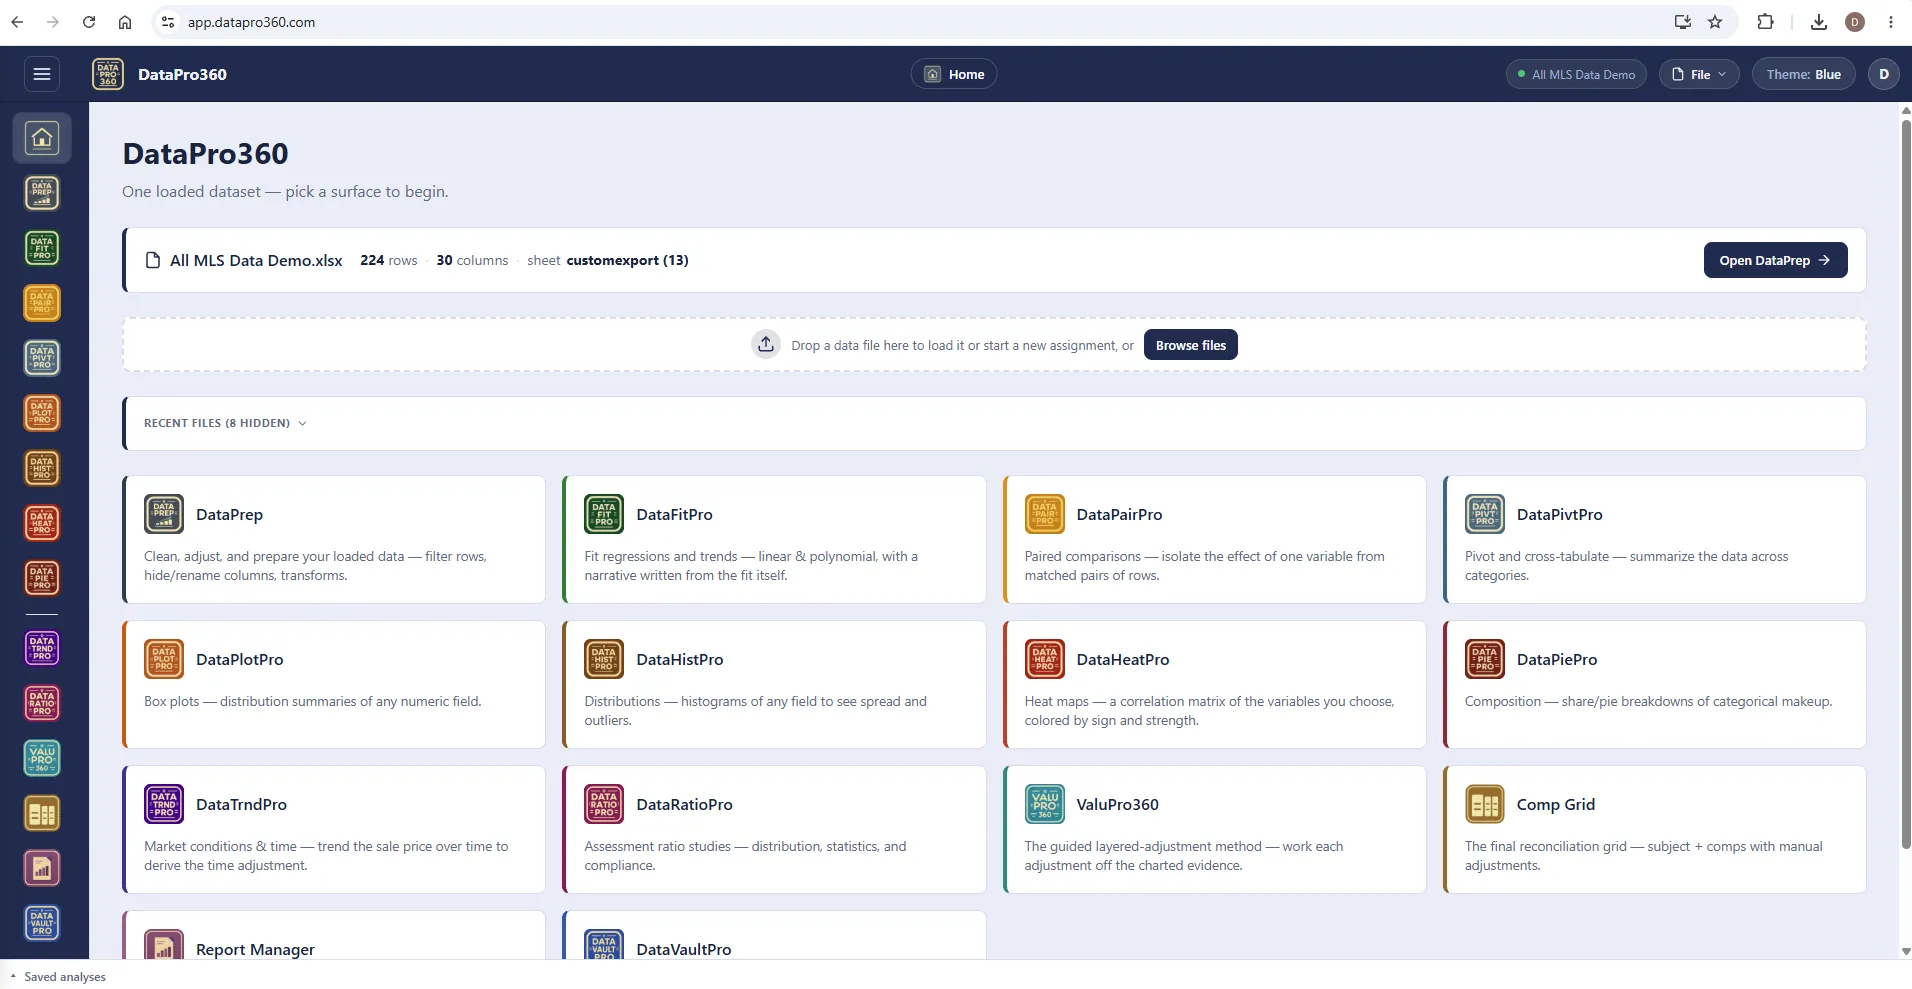
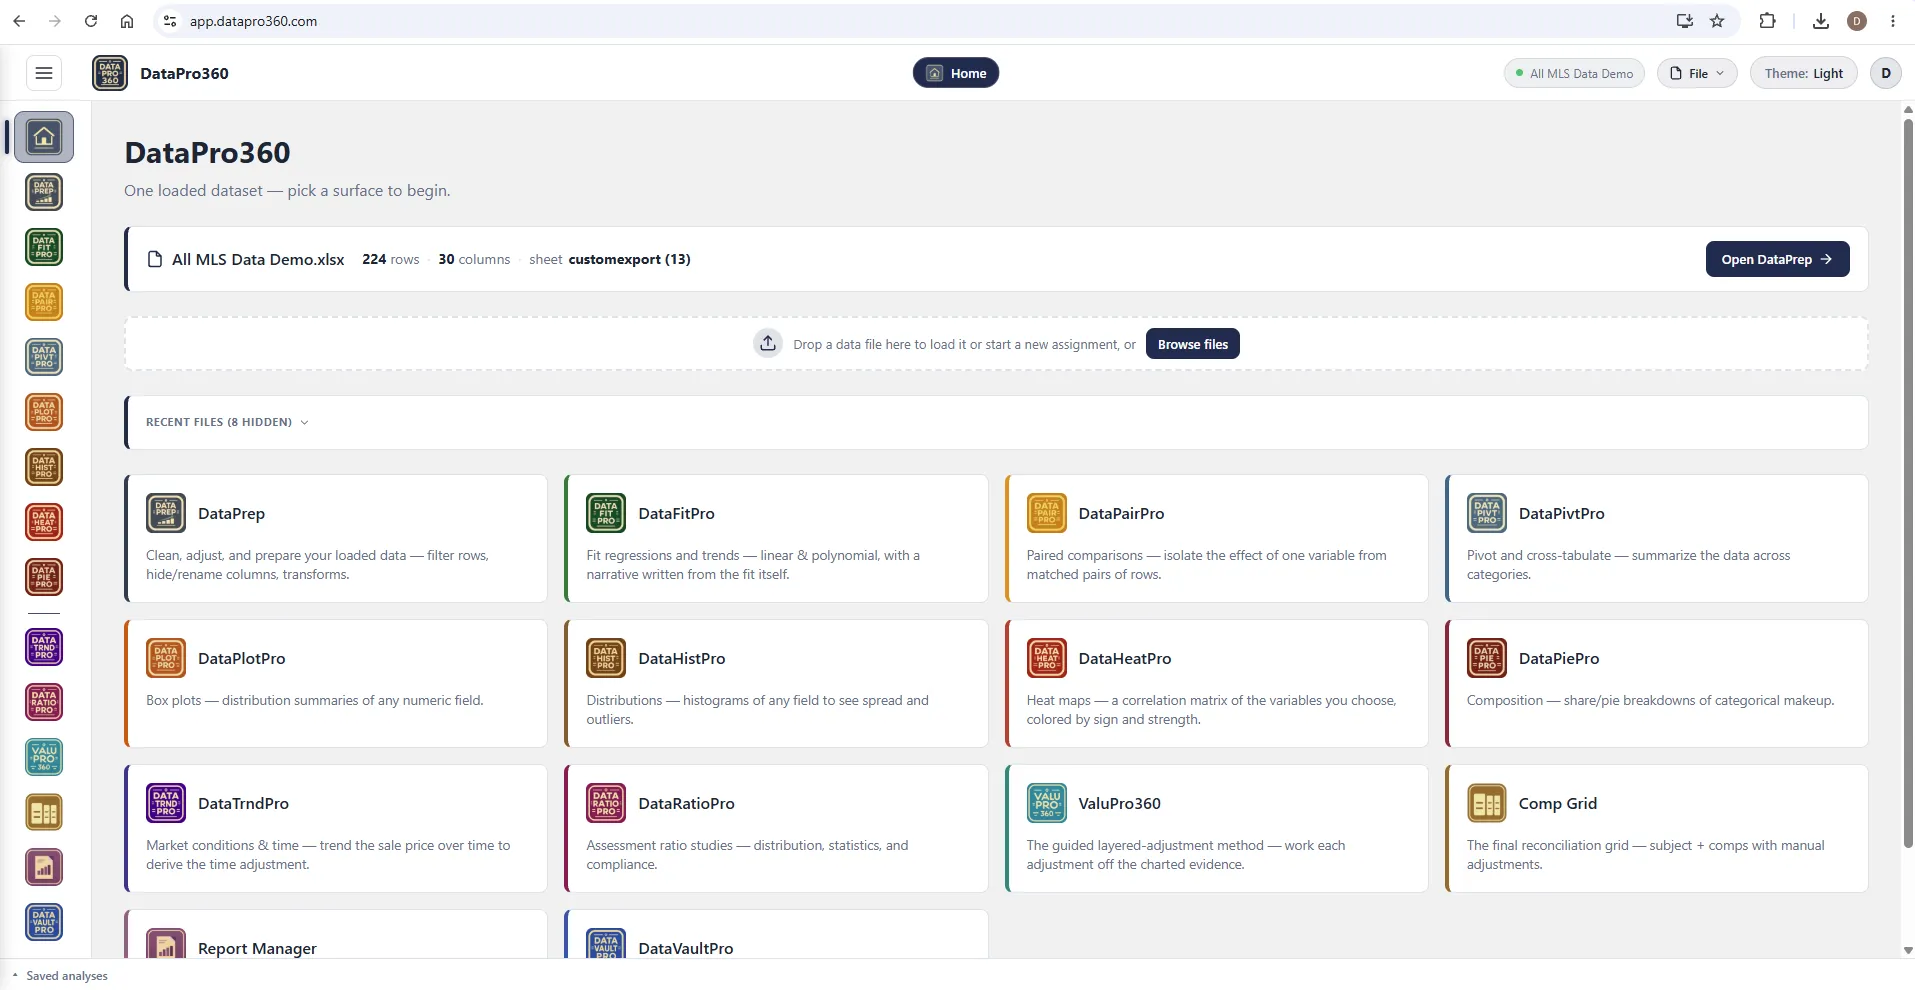
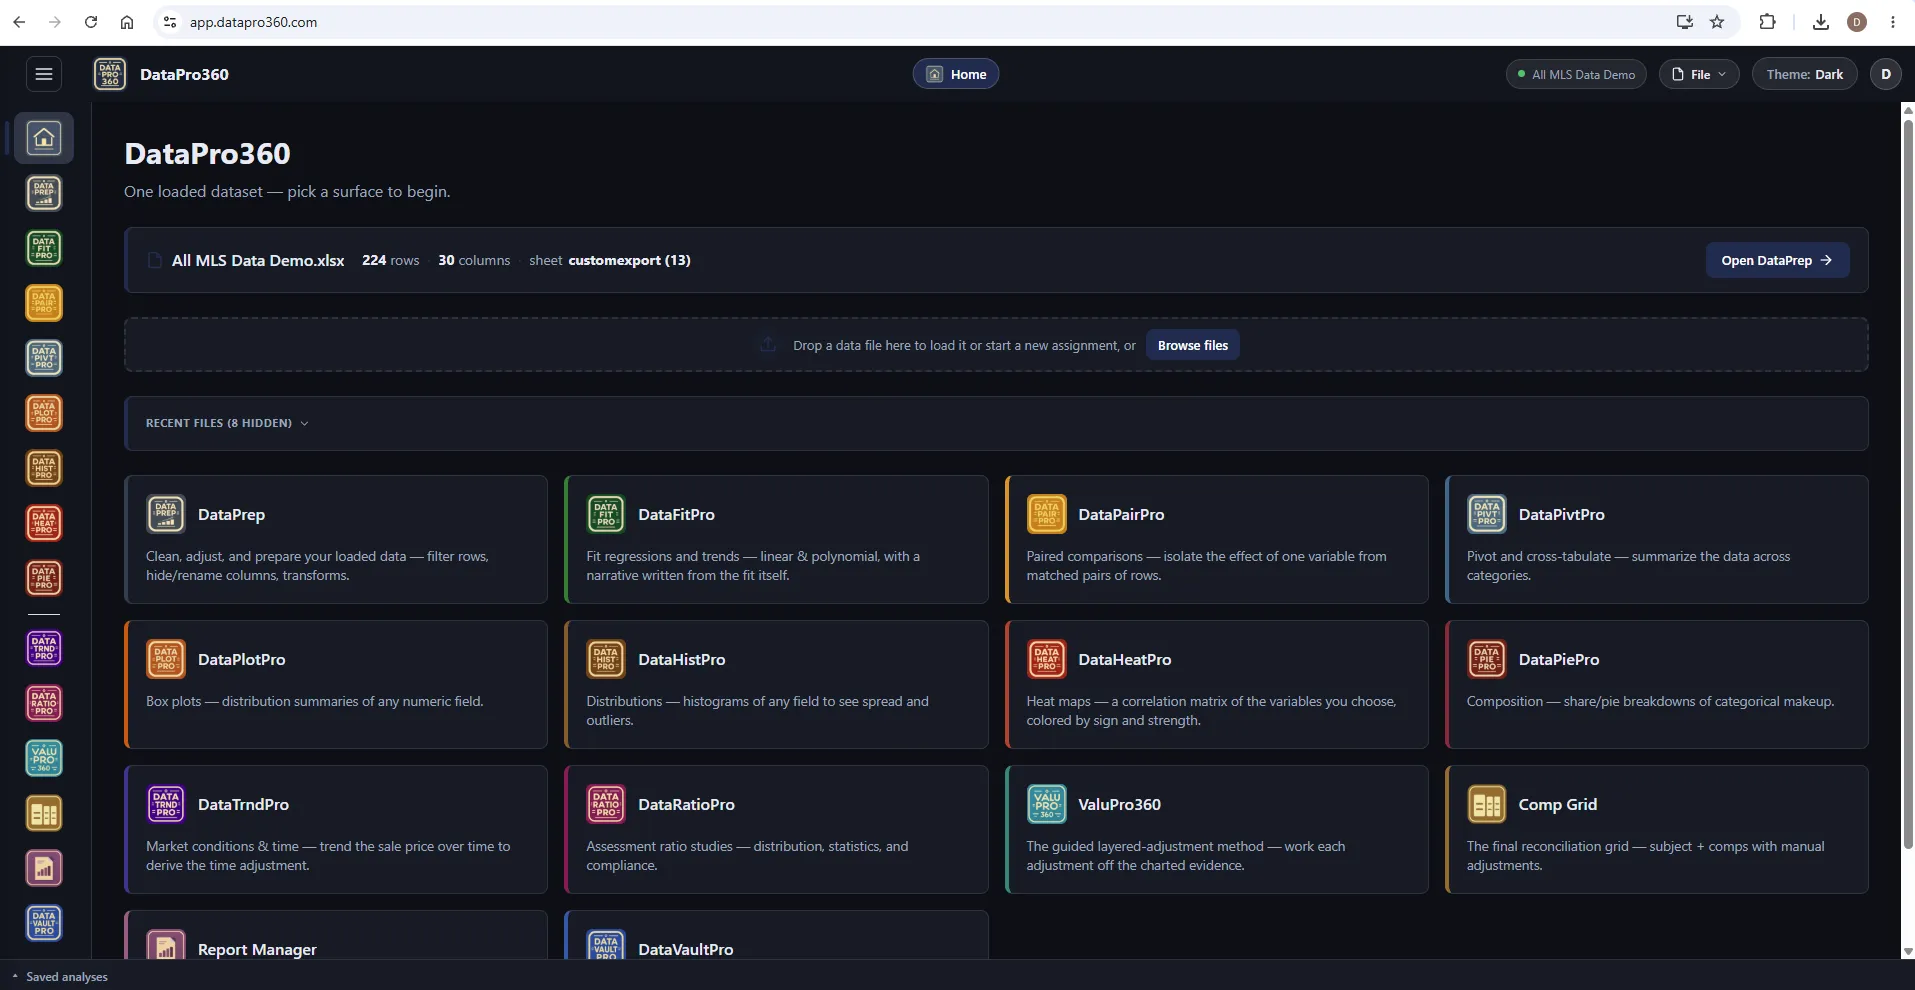
Three themes
Blue, Light, or Dark — works the way you like to work.
The same surface, three registers. Switch from the top bar; every chart and export follows.
Support
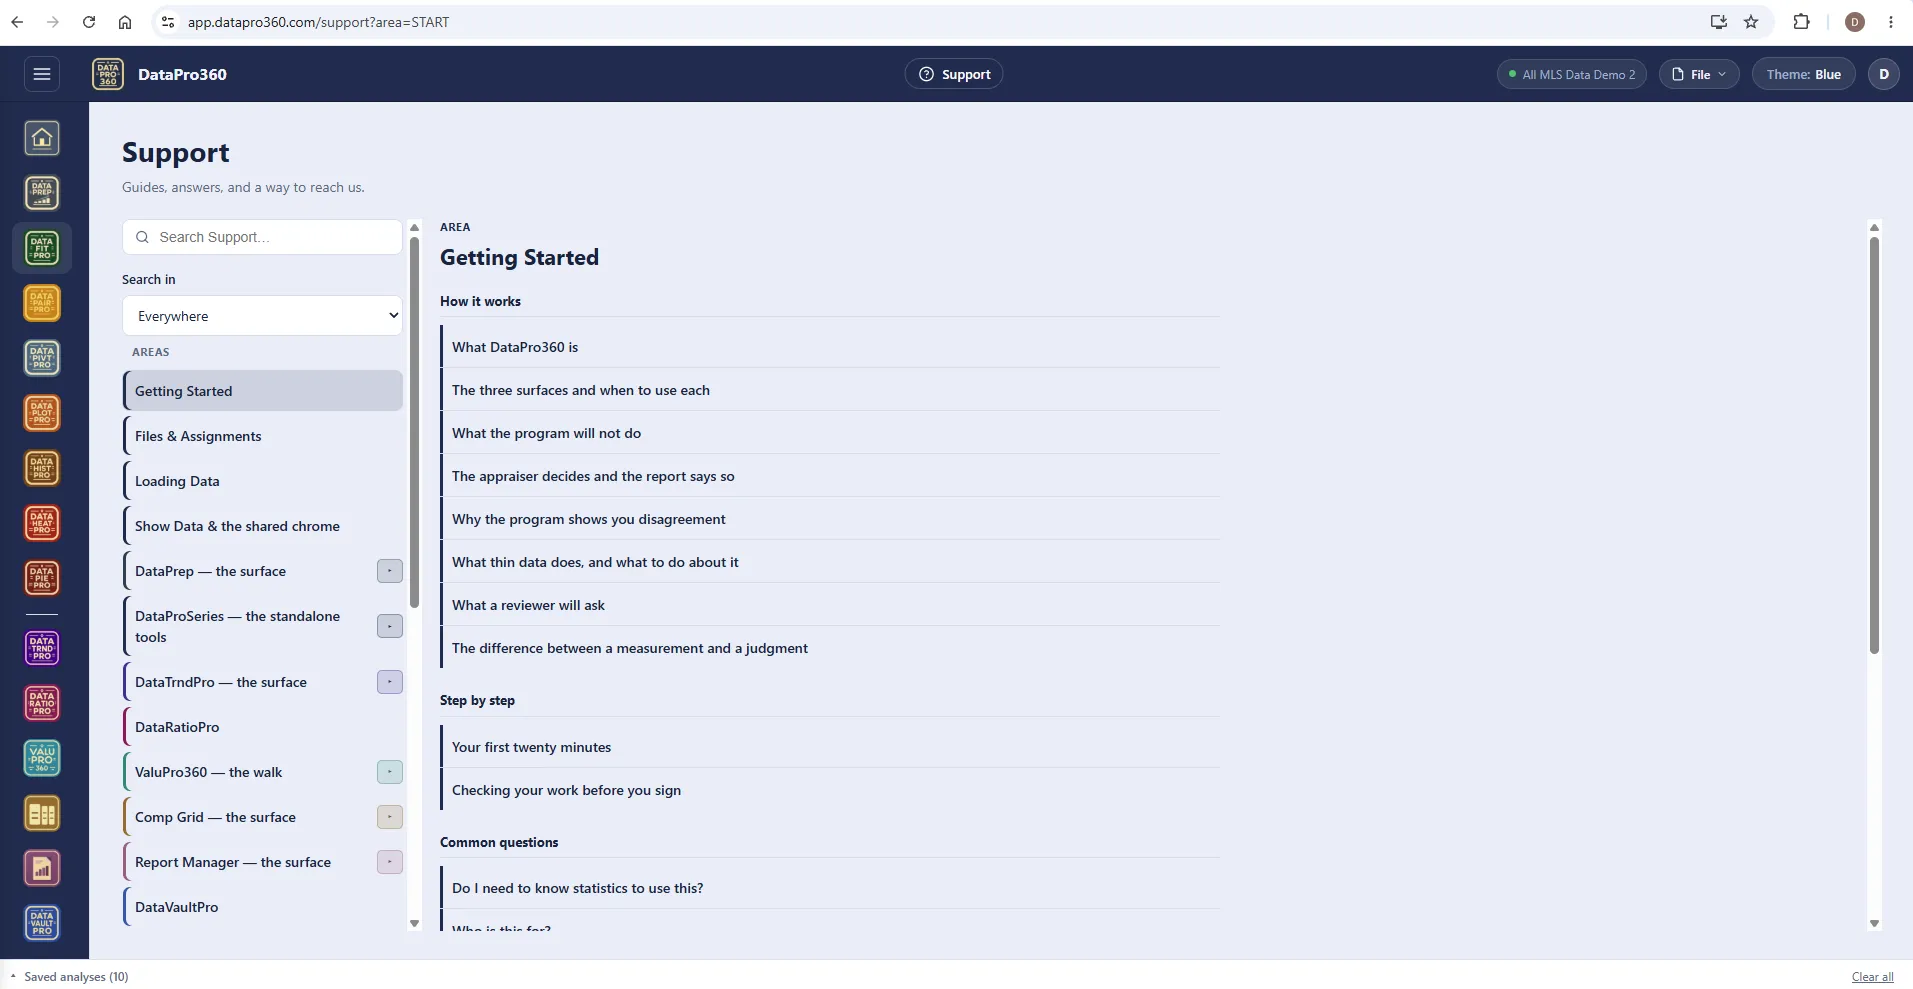
Built like a training ground.
More than 500 help entries across the program — a getting-started walk, the ValuPro360 walk station by station, videos, a glossary, and the questions a reviewer will ask. Help sits behind the on every screen, so the answer is where the question is.
Explore Support →The finished report
Word or PDF out the other end.
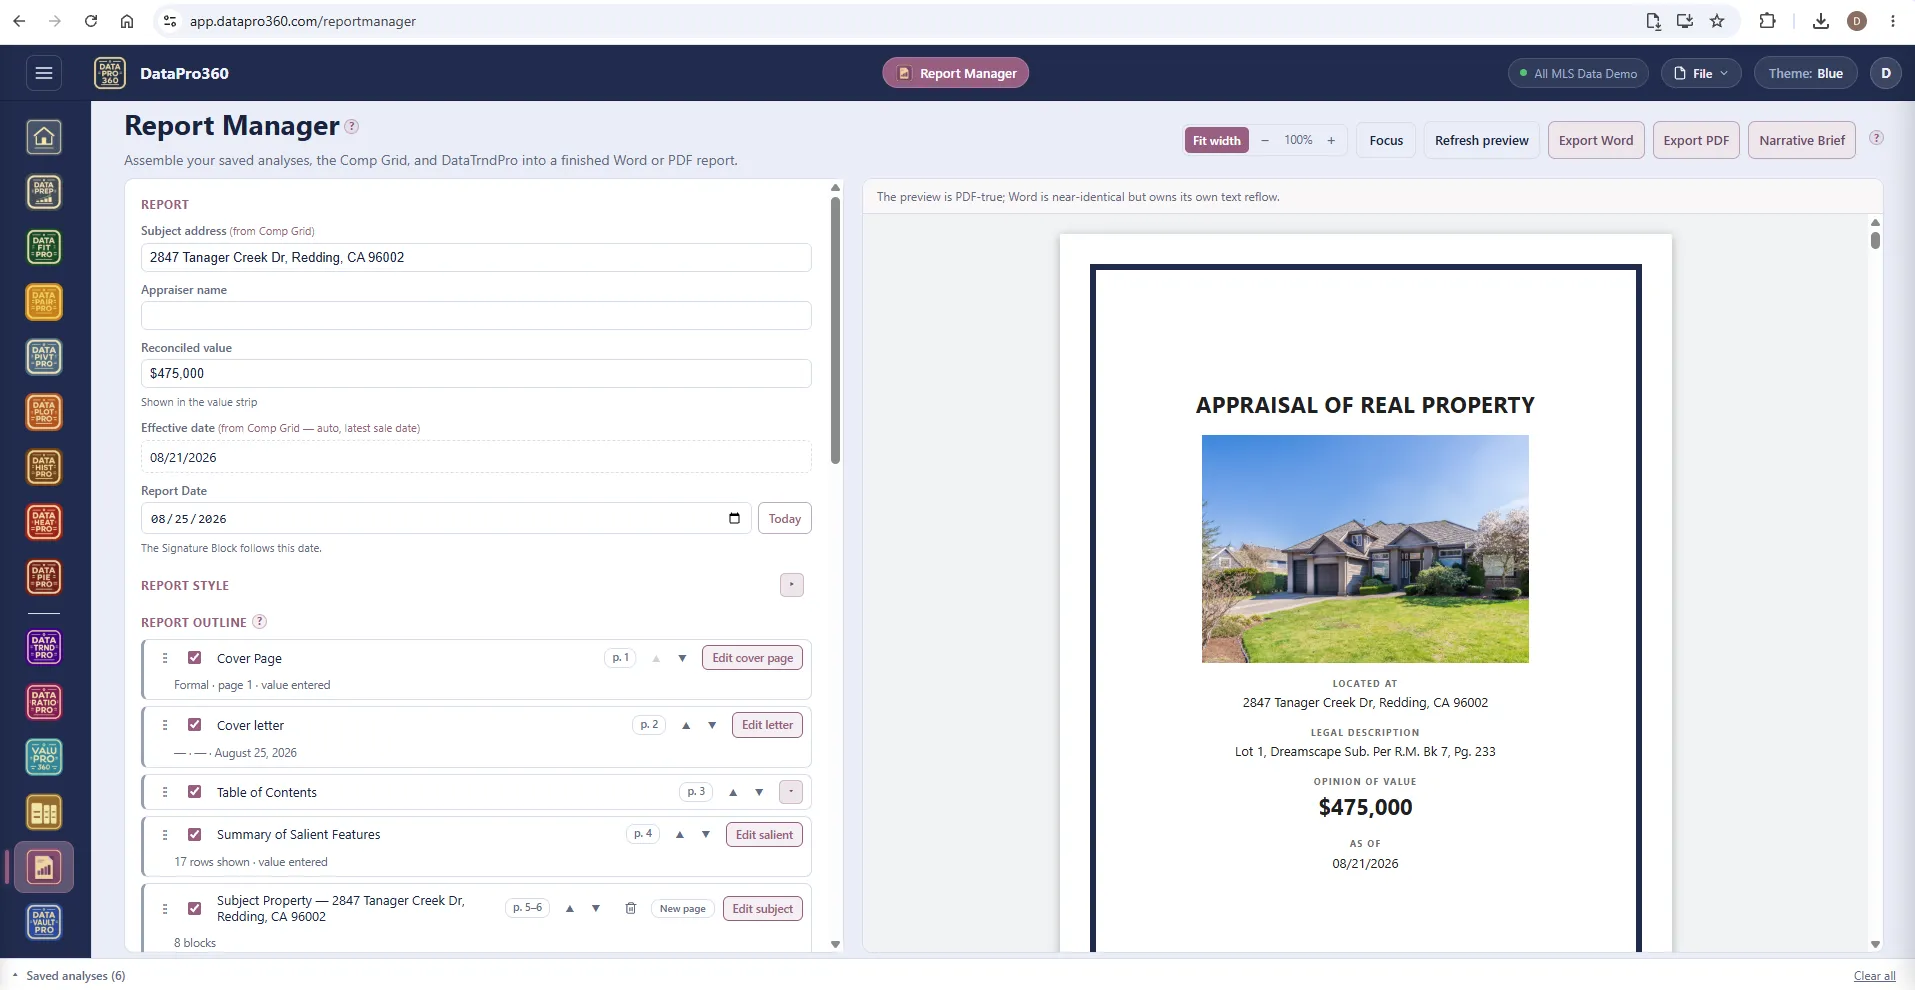
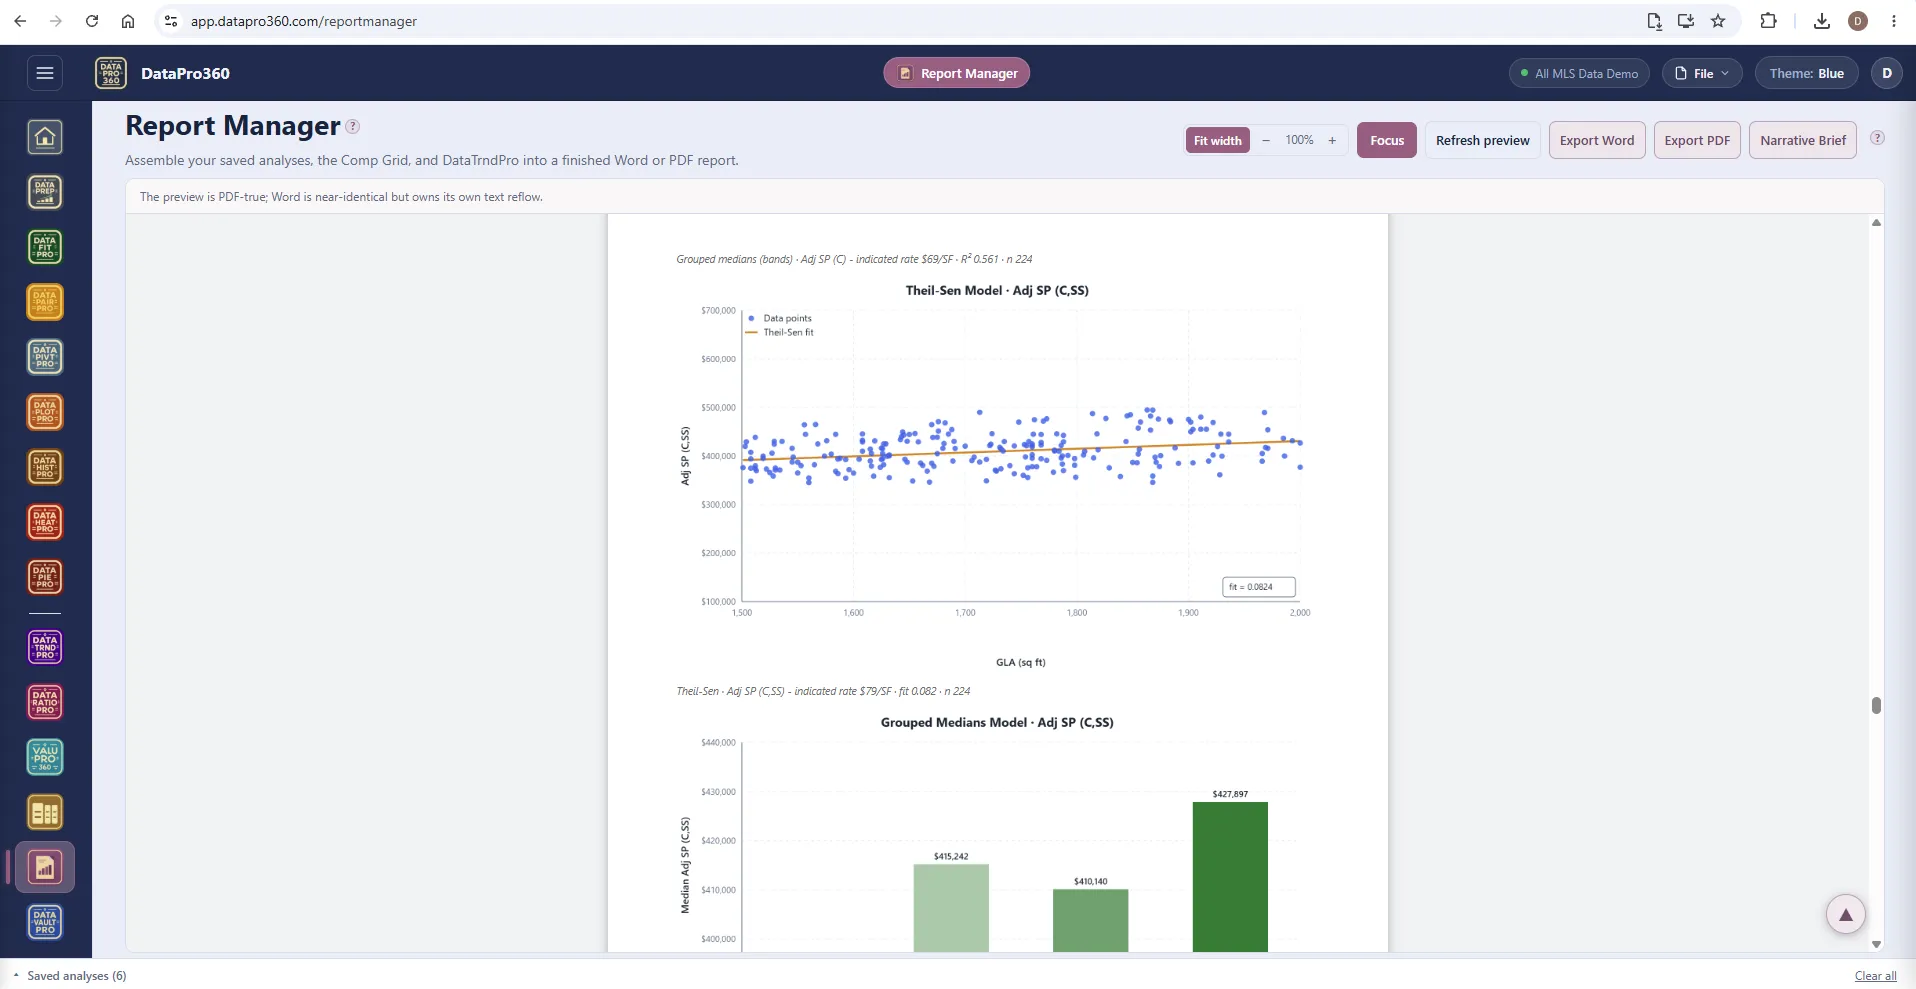
Report Manager assembles your saved analyses, the Comp Grid, and DataTrndPro into a paginated report you can hand over — or take the exhibits into the form software you already use.
-
Export Word or PDF
The preview is PDF-true; the Word export owns its own text reflow.
-
Document import
Bring PDFs and Word documents into the report as sections — inspection reports and engagement letters straight into the file.
-
Narrative Brief
A briefing file you can hand to an assistant or a service of your own. DataPro360 itself sends nothing anywhere.
-
Cover to signature
Cover page, cover letter, table of contents, salient features, subject pages, comp pages, photos, maps, the grid, and every saved analysis.
Prove the numbers in your next report.
Load your own MLS export and work a real assignment through the trial — every chart, every method, the finished report.
$69.95 per user, per month. 30-day free trial, no credit card required. No long-term contract.