
DataRatioPro
Assessment ratio studies for assessors and appeal work — level, equity, and the statistics that answer both.
Assessment ratio studies — distribution, statistics, and compliance.
What it does
A ratio study compares assessed value to market value. For each property in the study the ratio is the assessed value divided by a measure of market value, and the study describes how those ratios behave across a group of properties rather than at any one of them. Two questions come out of it. Level: are assessments sitting at about the share of value they are meant to sit at? Equity: are like properties treated alike, and are low-value and high-value properties treated the same way as each other? The median answers the first. The coefficient of dispersion, the price-related differential and the price-related bias answer the second.
The engine is generic. Assessed value divided by sale price is the assessor's case; sale price divided by list price and an automated valuation divided by sale price are two others. The math is identical and the column names come from the file, so a study reads as an assessment ratio study because those are the columns that were chosen, never because the prose asserts it. A compliance standard is an optional overlay — most California counties and the Board of Equalization do not follow IAAO — with editable acceptable ranges and a scorecard when you elect one.
The sales are a sample; the roll is the population. N is the number of sales the statistics were computed on, not the number of parcels the study describes, and every figure reported is an estimate of a roll-wide condition made from the part of the roll that changed hands. Three scenarios sit side by side — all sales, trimmed at 1.5×IQR, and a corrected scenario that is explicitly hypothetical — with the flagged rows listed by distance from the median.
For appeal work, the subject is placed against the distribution and never enters it: its percentile, its distance from the median, and what it would be at the market's median ratio — pulled from the Comp Grid or entered directly. Proposition 13 sets a base year at transfer, so a long-held parcel carries a lawfully low ratio that is statute, not error; restricting the study to recent transfers measures performance rather than a mix of performance and law. A ratio study measures the performance of a group. It does not value any individual property; what a single property should be assessed at is answered by an appraisal of that property.
- Median, mean and weighted mean ratio
- COD — coefficient of dispersion
- PRD — price-related differential
- PRB — price-related bias, with its standard error
- All sales · Trimmed 1.5×IQR · Corrected (hypothetical)
- Standards scorecard when a standard is elected
- Subject placement and the transfer-date window
- Narrative in the assessor's voice or the appraiser's, for appeal
Two columns, or an existing ratio column.
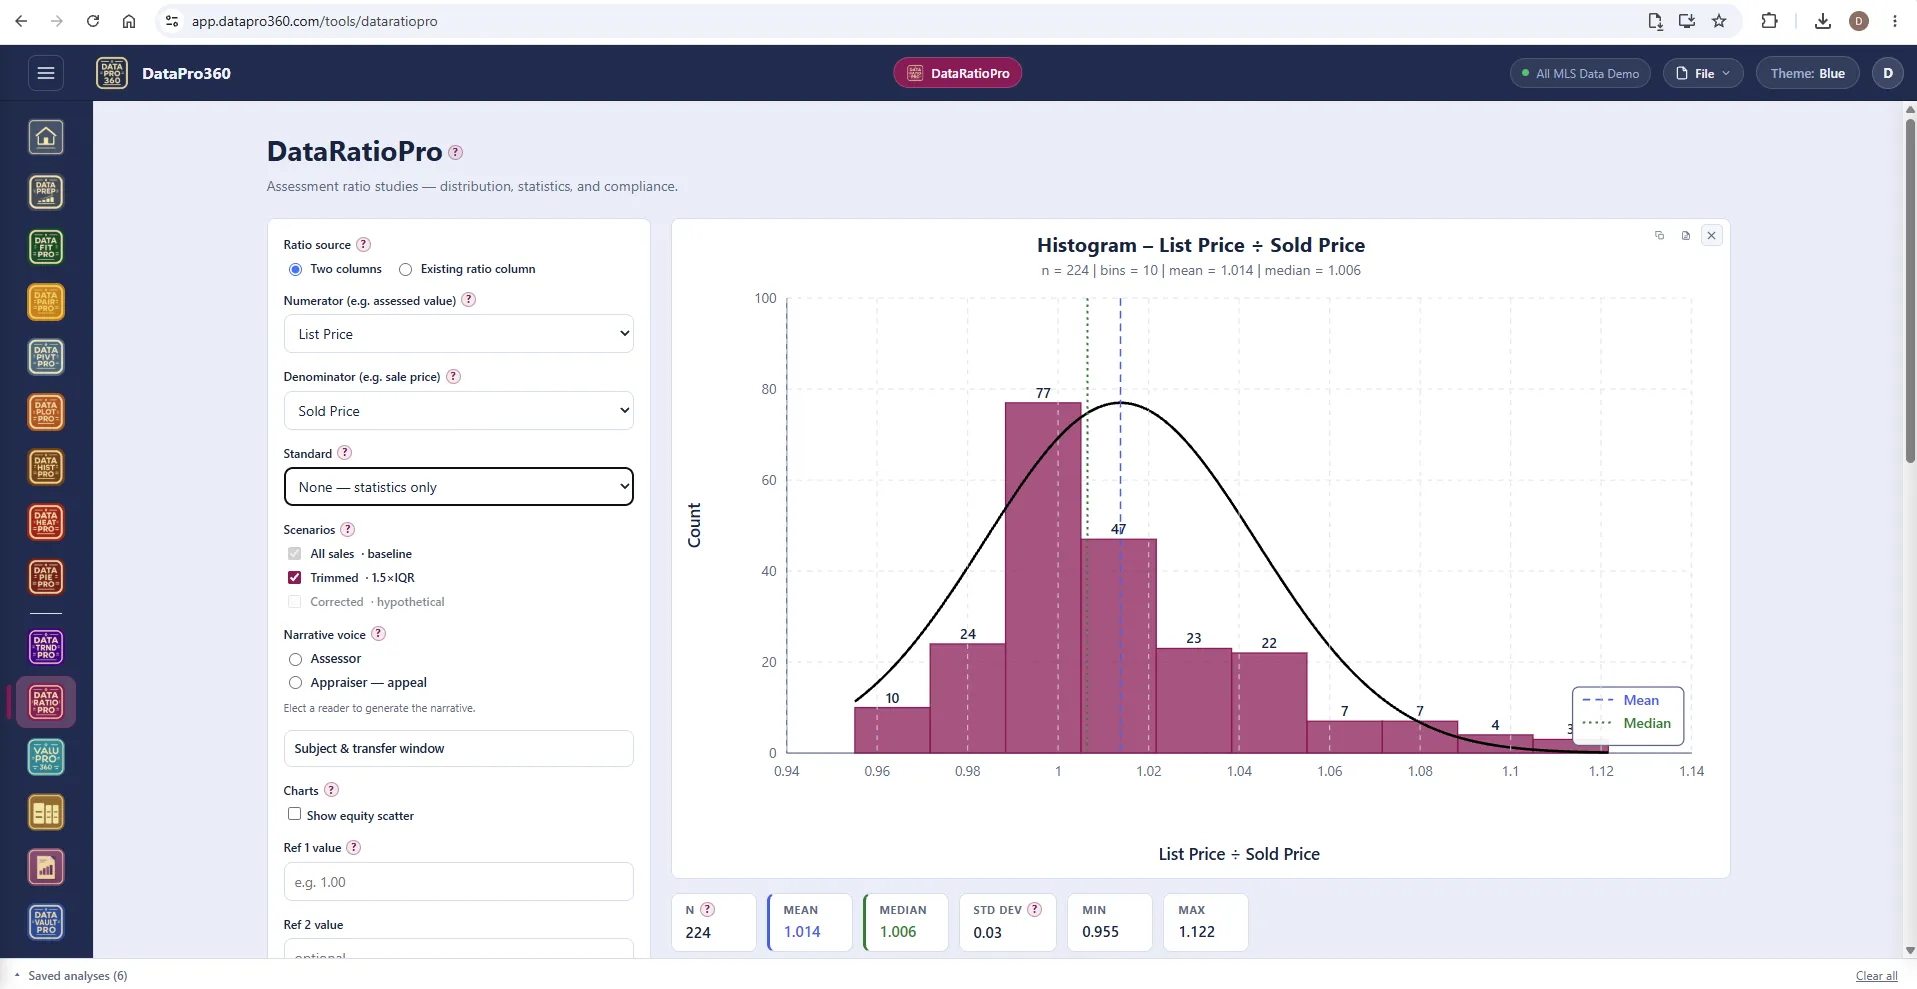
Pick the numerator and the denominator — or a ratio the file already carries. Choose a standard or none, the scenarios to run, the narrative voice, and the reference markers; the histogram draws the distribution with mean, median and a normal-curve overlay, and the statistics strip reads n, mean, median, standard deviation, minimum and maximum for what is included.
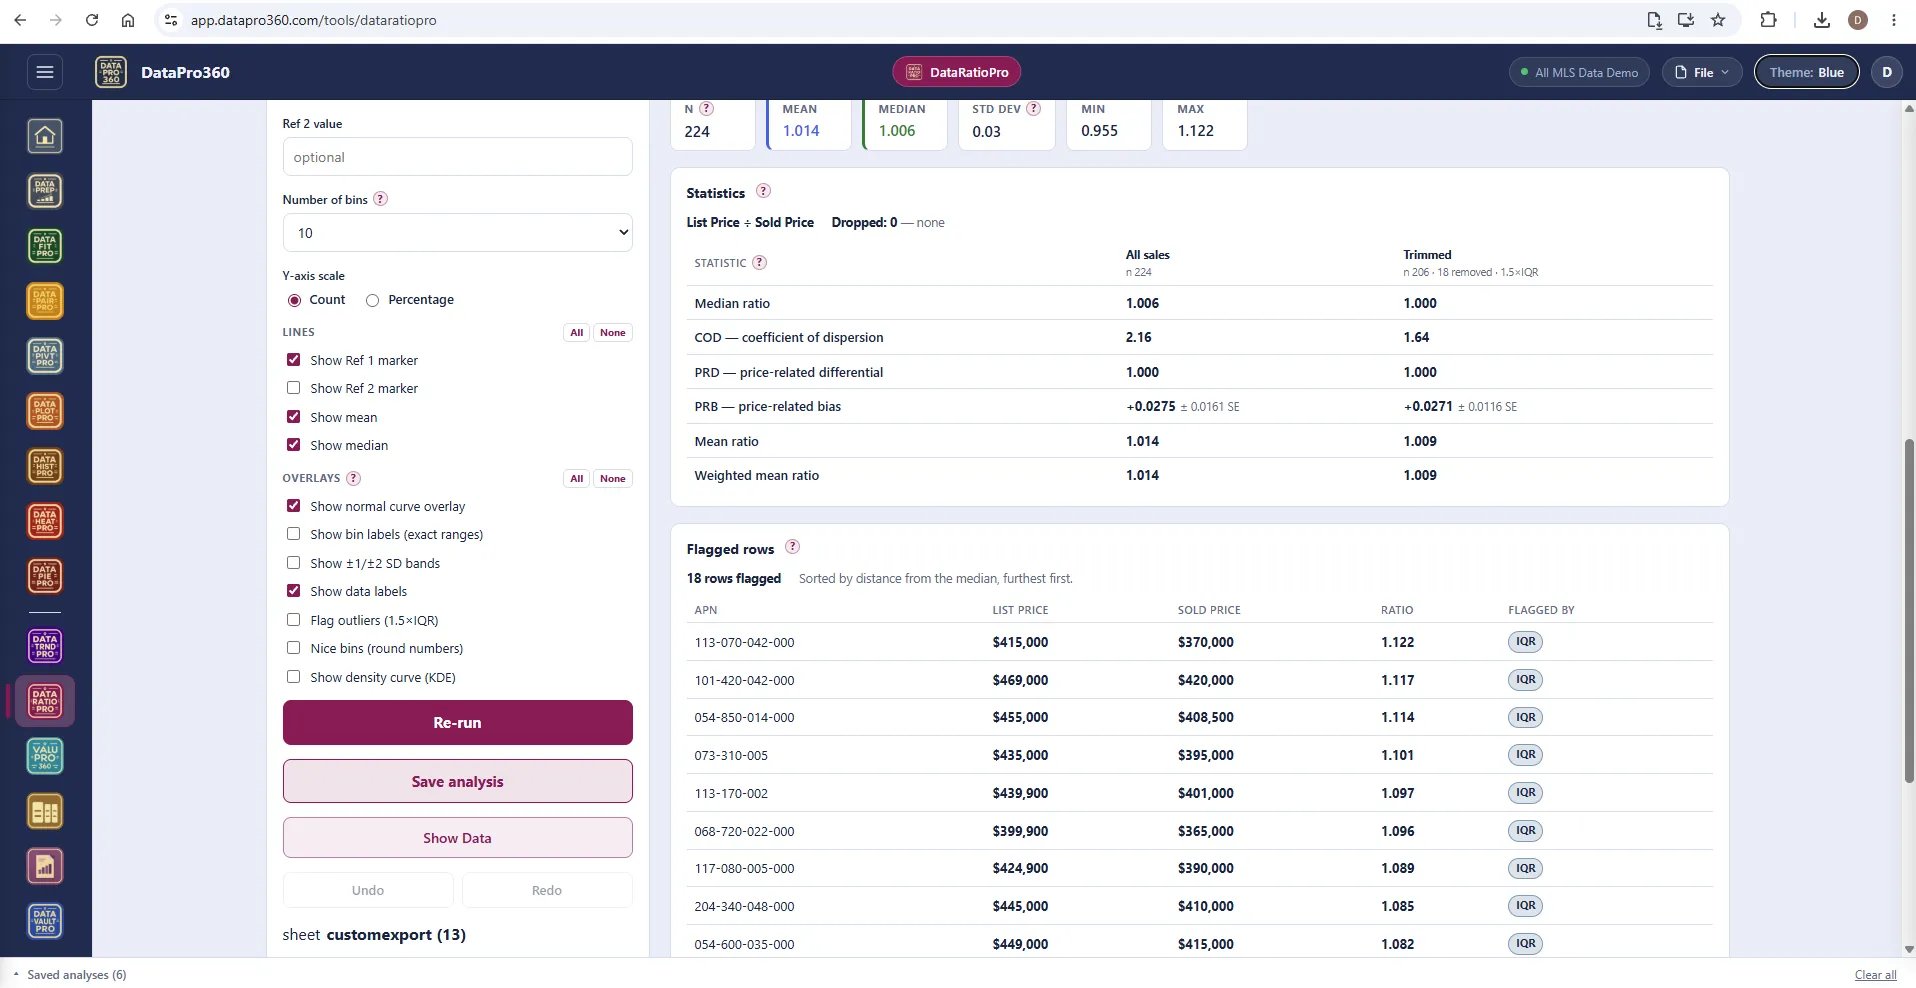
The statistics table — level and equity, side by side.
Median ratio, COD, PRD, PRB with its standard error, mean and weighted mean — for all sales and for the trimmed scenario, with the number removed stated. Below it the flagged rows, sorted by distance from the median, each with what flagged it. Dropped rows — missing or non-positive values that never entered the study — are reported separately from anything excluded by hand.
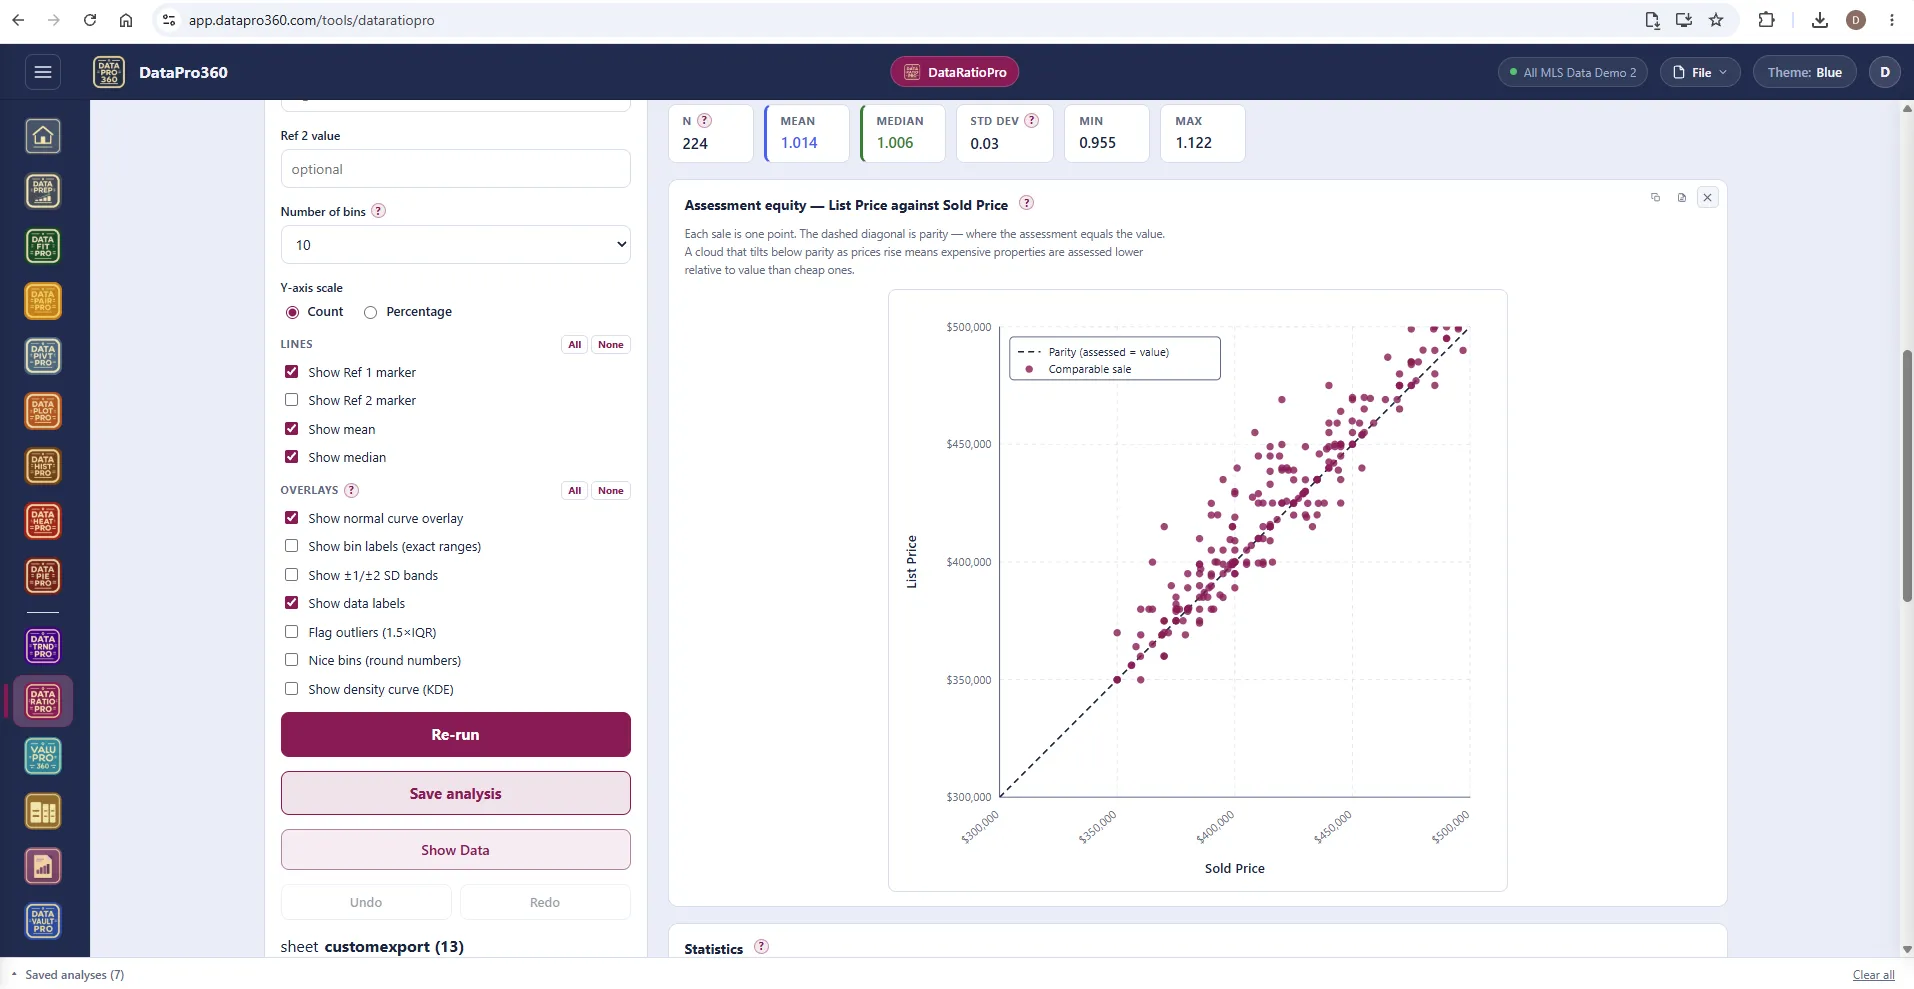
The equity scatter.
Each sale is one point; the dashed diagonal is parity, where the assessment equals the value. A cloud that tilts below parity as prices rise means expensive properties are assessed lower relative to value than cheap ones — regressivity you can see before you read the PRD.
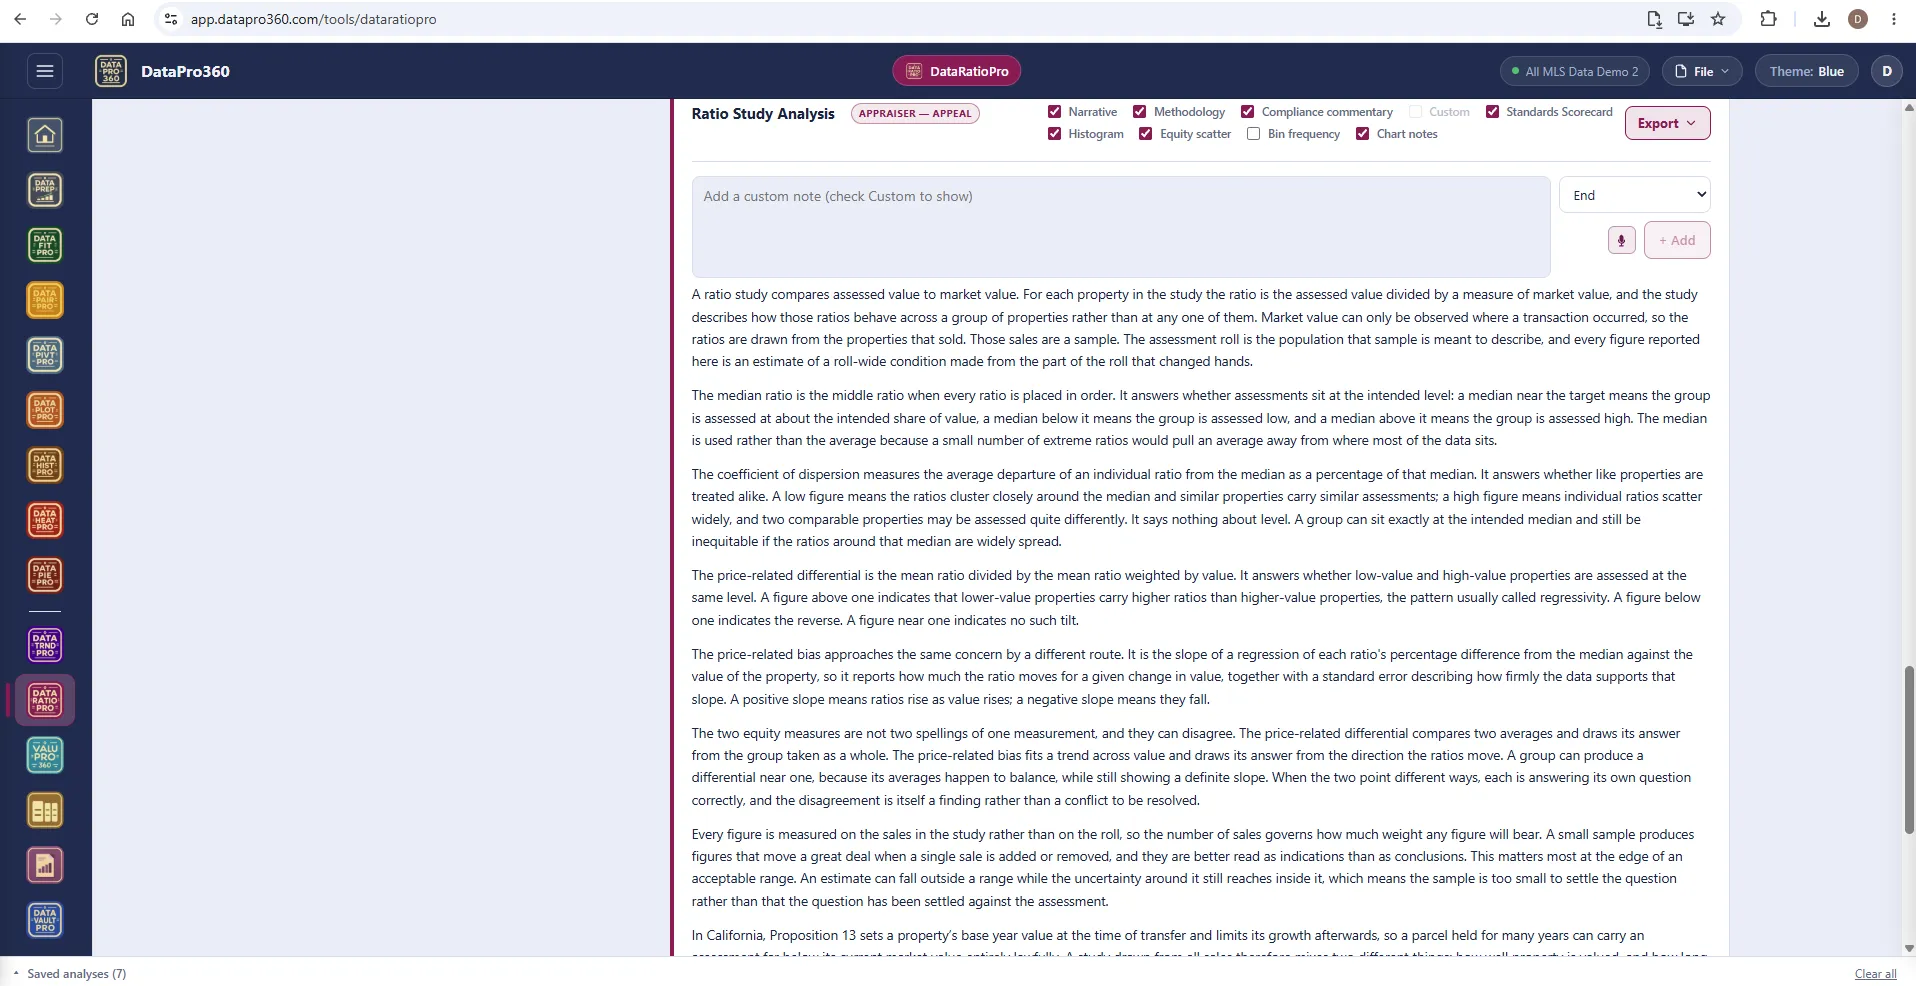
The narrative, in the reader's voice.
Elect the reader — assessor, or appraiser preparing an appeal — and the narrative is written for them: what a ratio study is, what the median answers, what the dispersion, the differential and the bias each measure and why they can disagree, how sample size governs the weight any figure will bear, and what Proposition 13 does to a study drawn from all sales. Layers for methodology, compliance commentary, the scorecard, the charts and bin frequencies; custom notes where you want them; export.
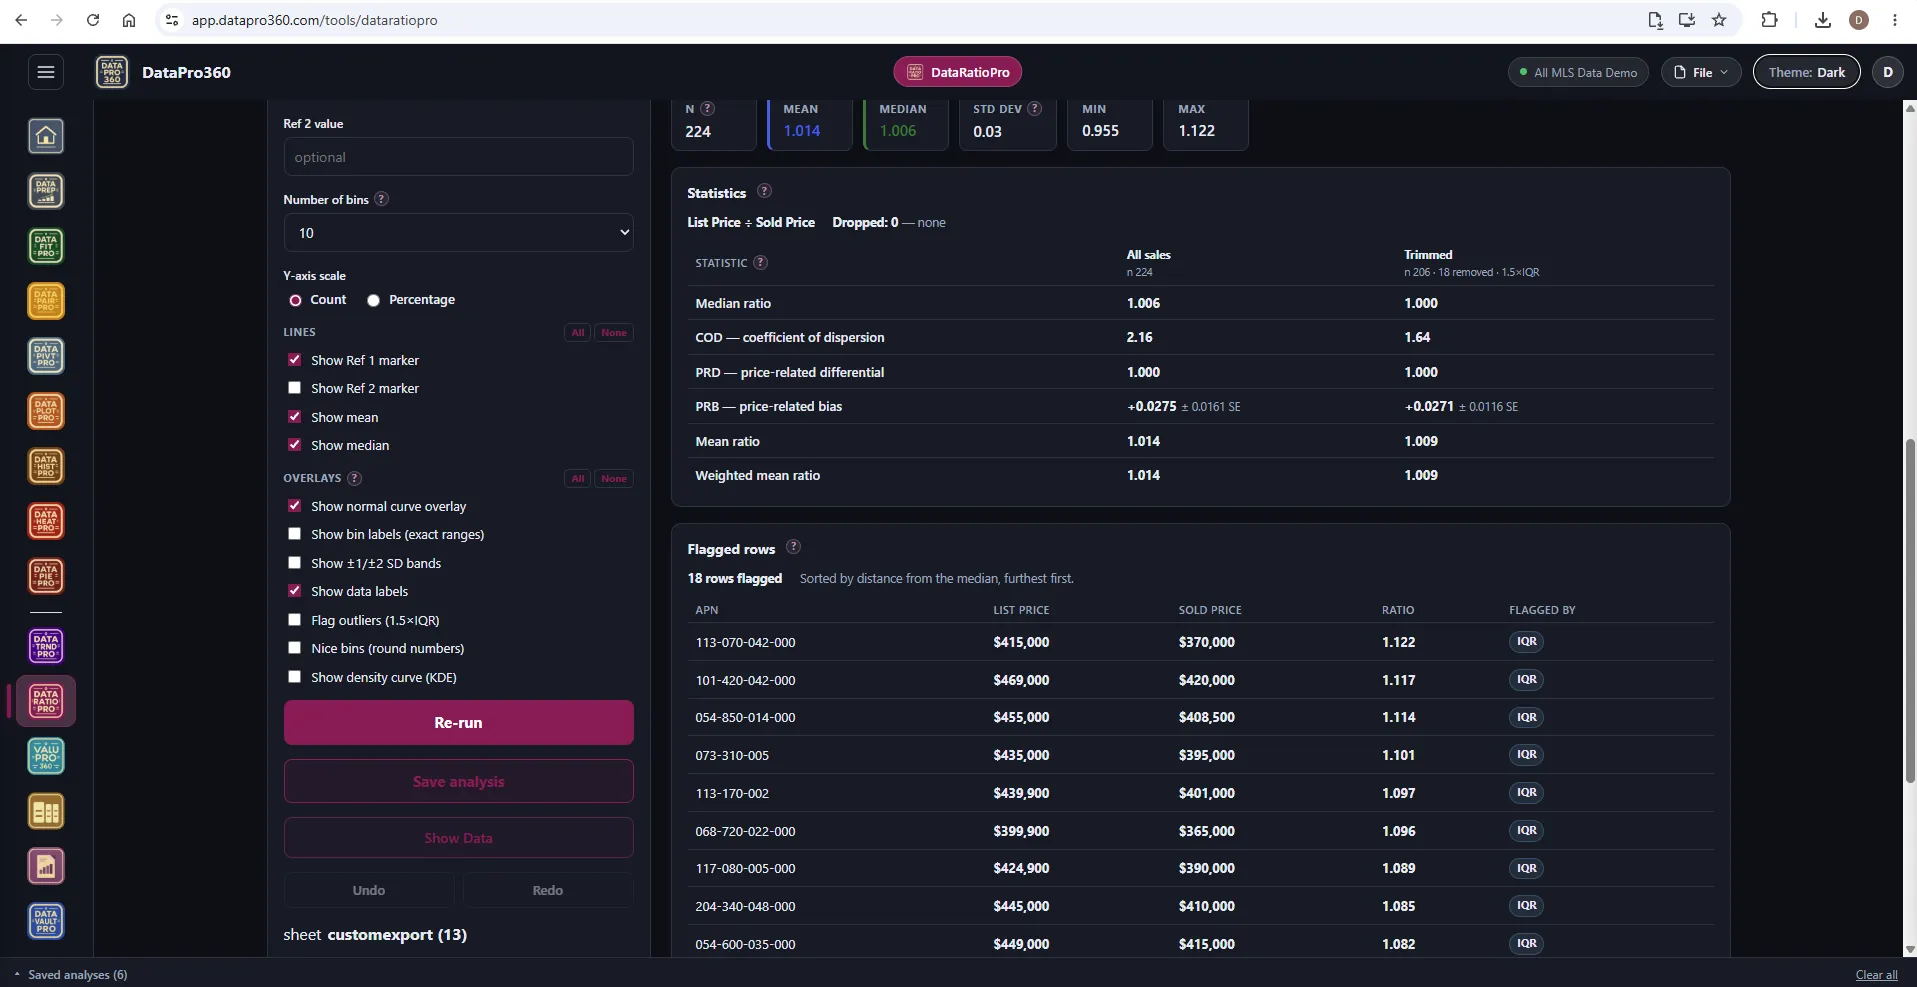
The statistics in the Dark theme.
The same table, the same flagged rows, on the dark workspace.
Where it sits
In the workflow
DataRatioPro reads the prepared dataset — assessed values and sale prices, or any two columns — and a saved study carries into Report Manager with its histogram, scatter, statistics table and narrative. The subject can be pulled straight from the Comp Grid for appeal work.
See the whole workflow →Before
 DataPrep
After
 Report Manager
Prove the numbers in your next report.
Load your own MLS export and work a real assignment through the trial — every chart, every method, the finished report.
$69.95 per user, per month. 30-day free trial, no credit card required. No long-term contract.