
ValuPro360
The guided walk through the layered-adjustment method — six stations, one adjustment each, every one derived from charted evidence.
The guided layered method — every adjustment off its charted evidence.
The method
What the walk is
ValuPro360 is the guided walk through the layered-adjustment method: six stations in a fixed order — Concessions, Time, Site, GLA, Amenities, Reconcile — each deriving one adjustment from the charted evidence before the next builds on it. The order is the method. Concessions come out first so every later read stands on cash-equivalent prices. Time comes out second so the remaining stations compare sales as of one market rather than across a moving one. Site and living area are separated before amenities so a feature's contribution is not confused with the size that travels with it.
Every station presents the same surface in the same arrangement: the price bases to solve against, the methods to solve with, the chart, and the derived results. You choose which methods run and which bases they run against; the station derives a rate from each, and the spread across methods is part of the evidence rather than a nuisance — agreement argues the rate is stable, disagreement says the data holds more than one story and puts the choice where it belongs.
Nothing is adopted for you. The appraiser decides what each station concludes, the decision is carried forward to the next layer, and the report says what was decided. Adopt a method's rate, override it, or apply the calculated value — three different acts, each recorded with its provenance. The stations produce evidence; the value opinion stays yours.
Skip the order and measure everything against the raw sale price, and every reading carries every other difference. That is the disease the layered order cures — and it is invisible in a grid that does not use it.
Station by station
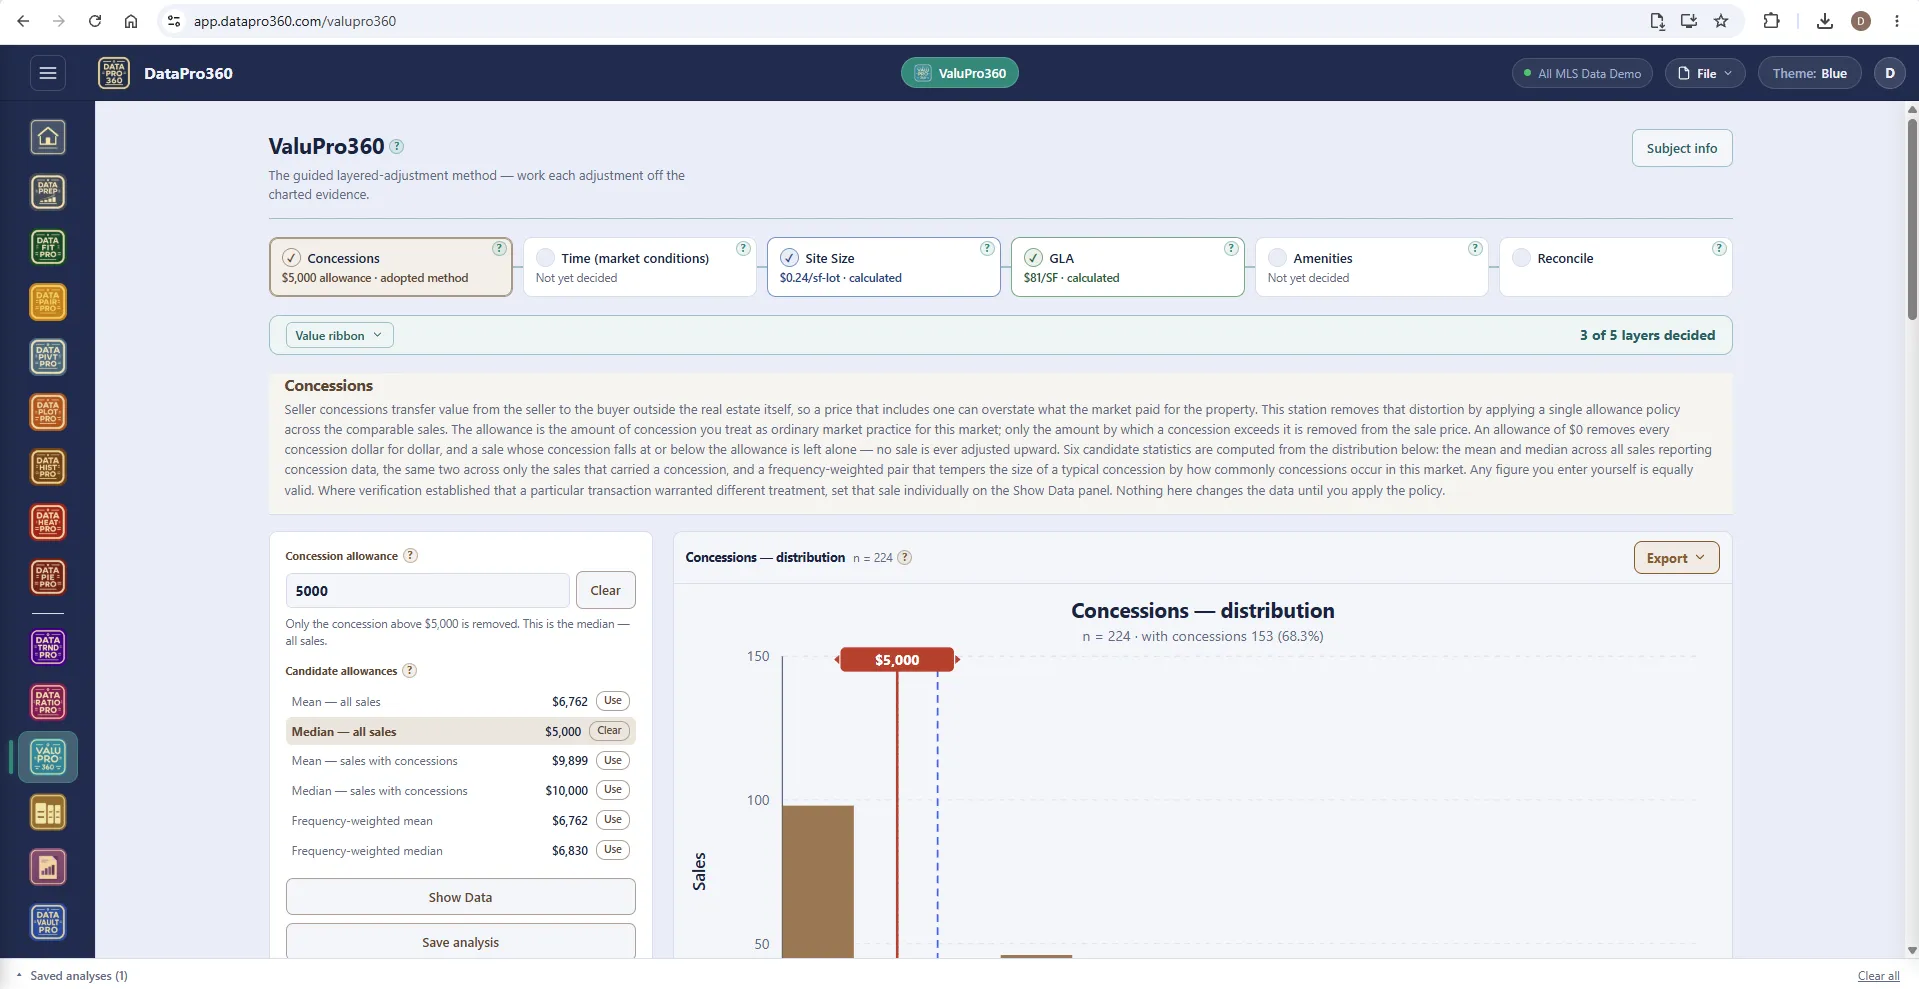
Concessions — one allowance policy, six candidates.
Seller concessions transfer value outside the real estate itself, so a price that includes one overstates what the market paid. The station computes six candidate allowances from the distribution — mean and median across all sales, across the sales that carried a concession, and frequency-weighted — and removes only the amount by which a concession exceeds the allowance you adopt. No sale is ever adjusted upward. Where verification says one transaction warrants different treatment, set that sale individually in Show Data.
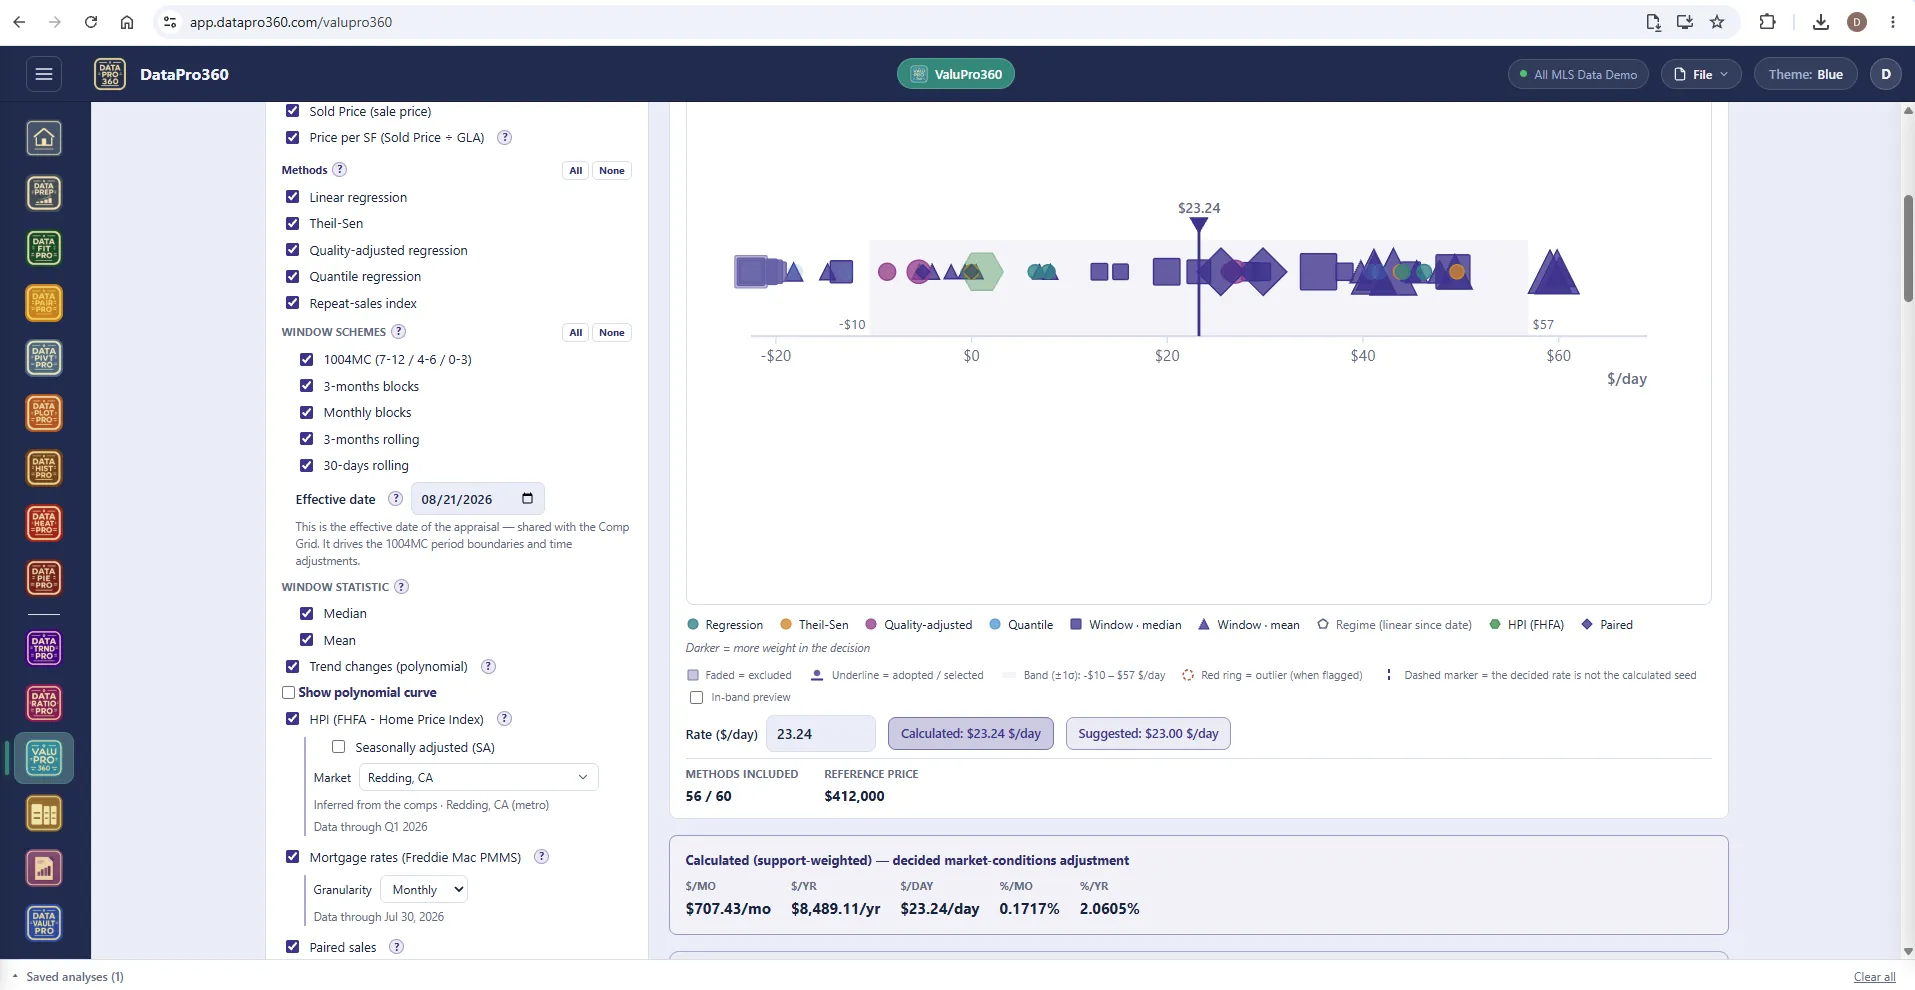
Time — every method on one $/day scale.
Linear regression, Theil-Sen, quality-adjusted and quantile regression, a repeat-sales index, window schemes — 1004MC periods, three-month and monthly blocks, rolling windows — trending median and mean, a polynomial trend-change test, paired sales, and the FHFA index as a benchmark. Each states a rate; the strip lays them on one scale with a support band, and the decided rate is stated in dollars or percent per day, month and year.
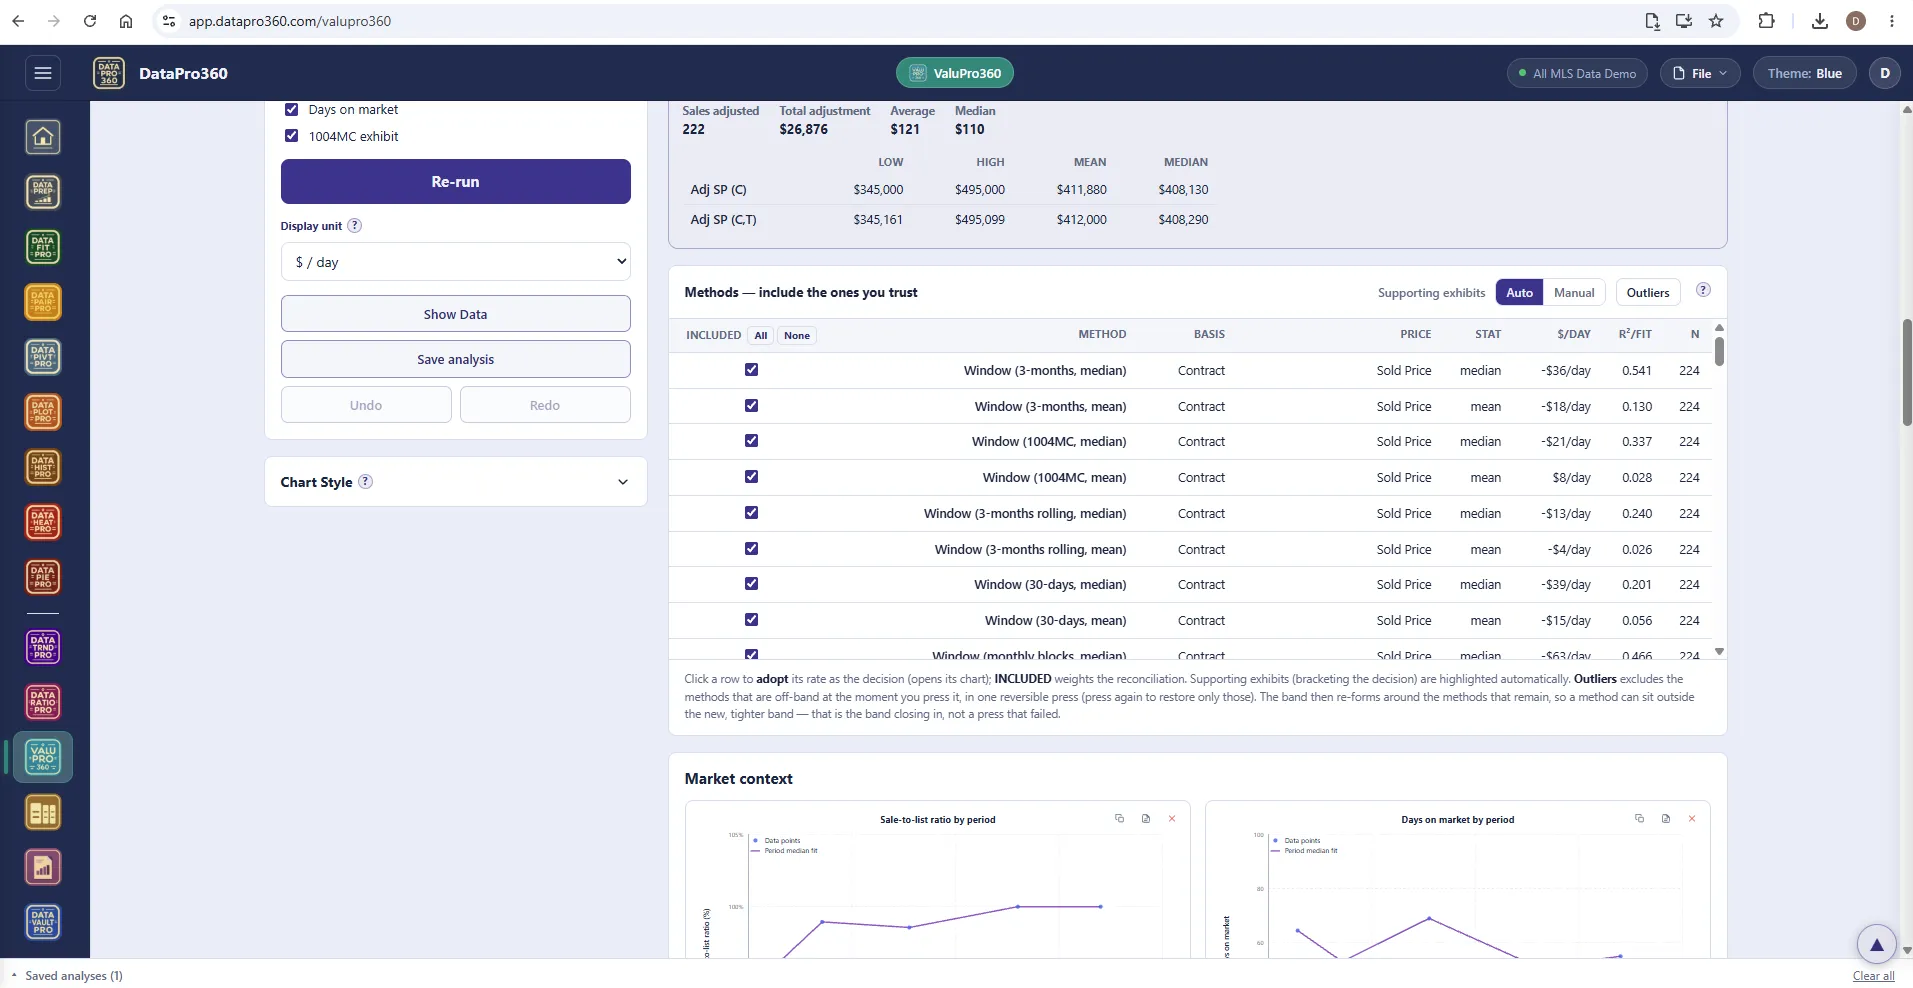
The methods table — include the ones you trust.
Every method lists its basis, price column, statistic, rate, fit and n. Auto highlights the supporting exhibits that bracket the decision; Outliers excludes the methods that sit off-band in one reversible press, and the band re-forms around what remains. Click a row to adopt its rate as the decision — the chart behind it opens.
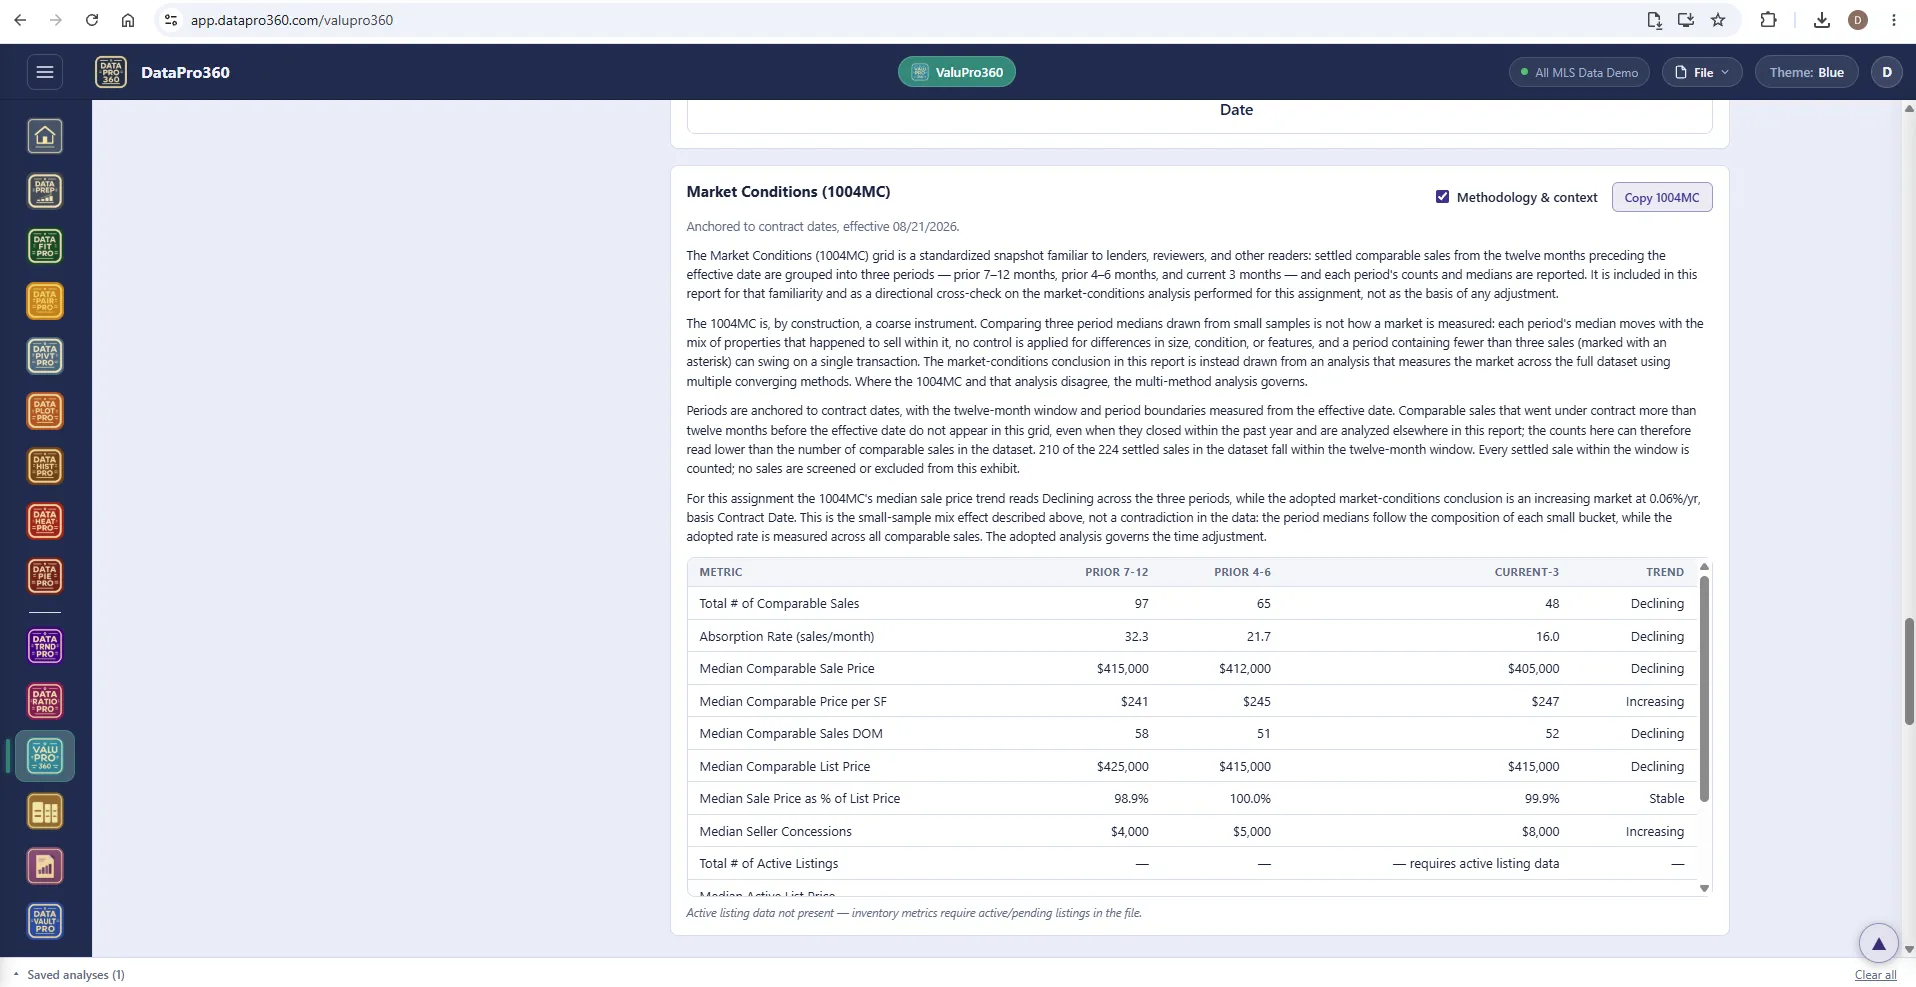
Market Conditions (1004MC) — a census, not a model.
The familiar three-period grid — prior 7–12, prior 4–6, current 3 months — with counts, absorption, medians and days on market, anchored to contract dates and the effective date. Every settled sale in the window is counted; the statistical screens do not apply, by design. It is included for familiarity and as a directional cross-check, never as the basis of an adjustment, and the methodology paragraph says so in the report.
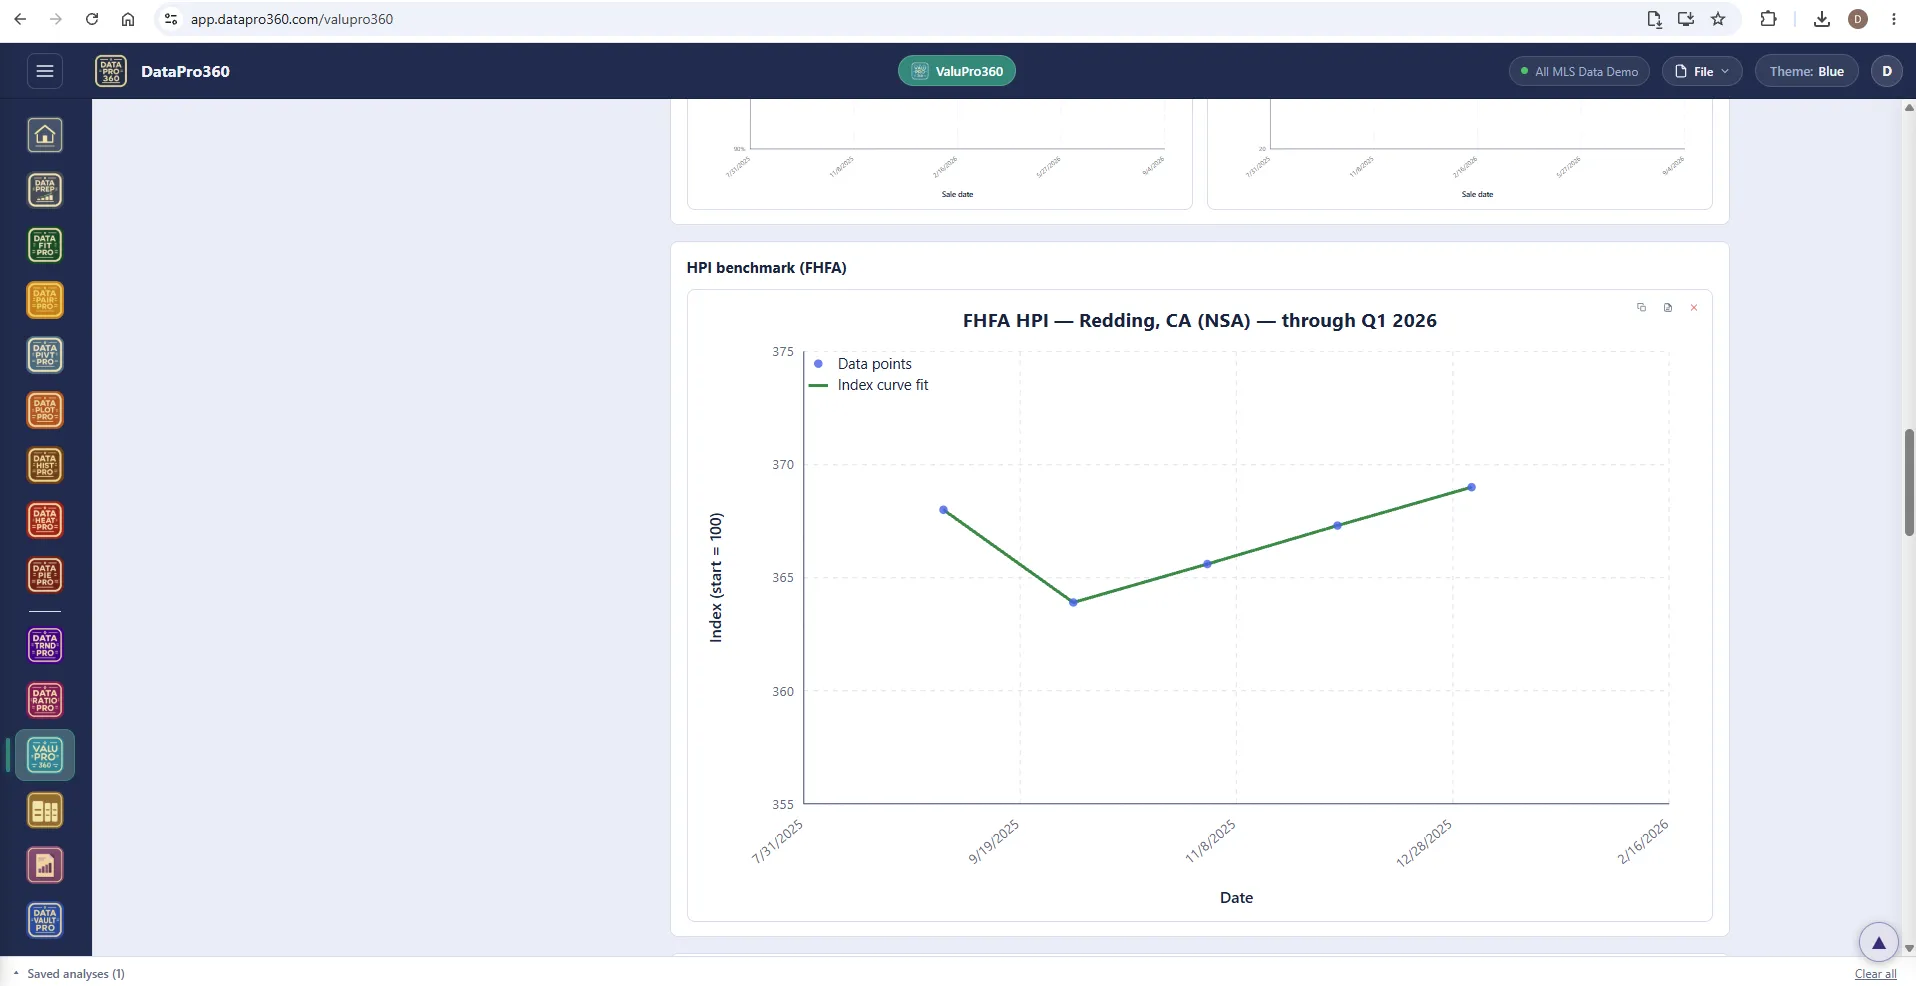
FHFA HPI — an outside index to check your own reading.
The value of a benchmark is that it is independent of your data: your rate comes from your records, the index from a much larger population. Agreement gives two roads to the same answer; disagreement is a question worth asking. Benchmarks enter as a method but are born excluded on a fresh run — including one is a deliberate act.
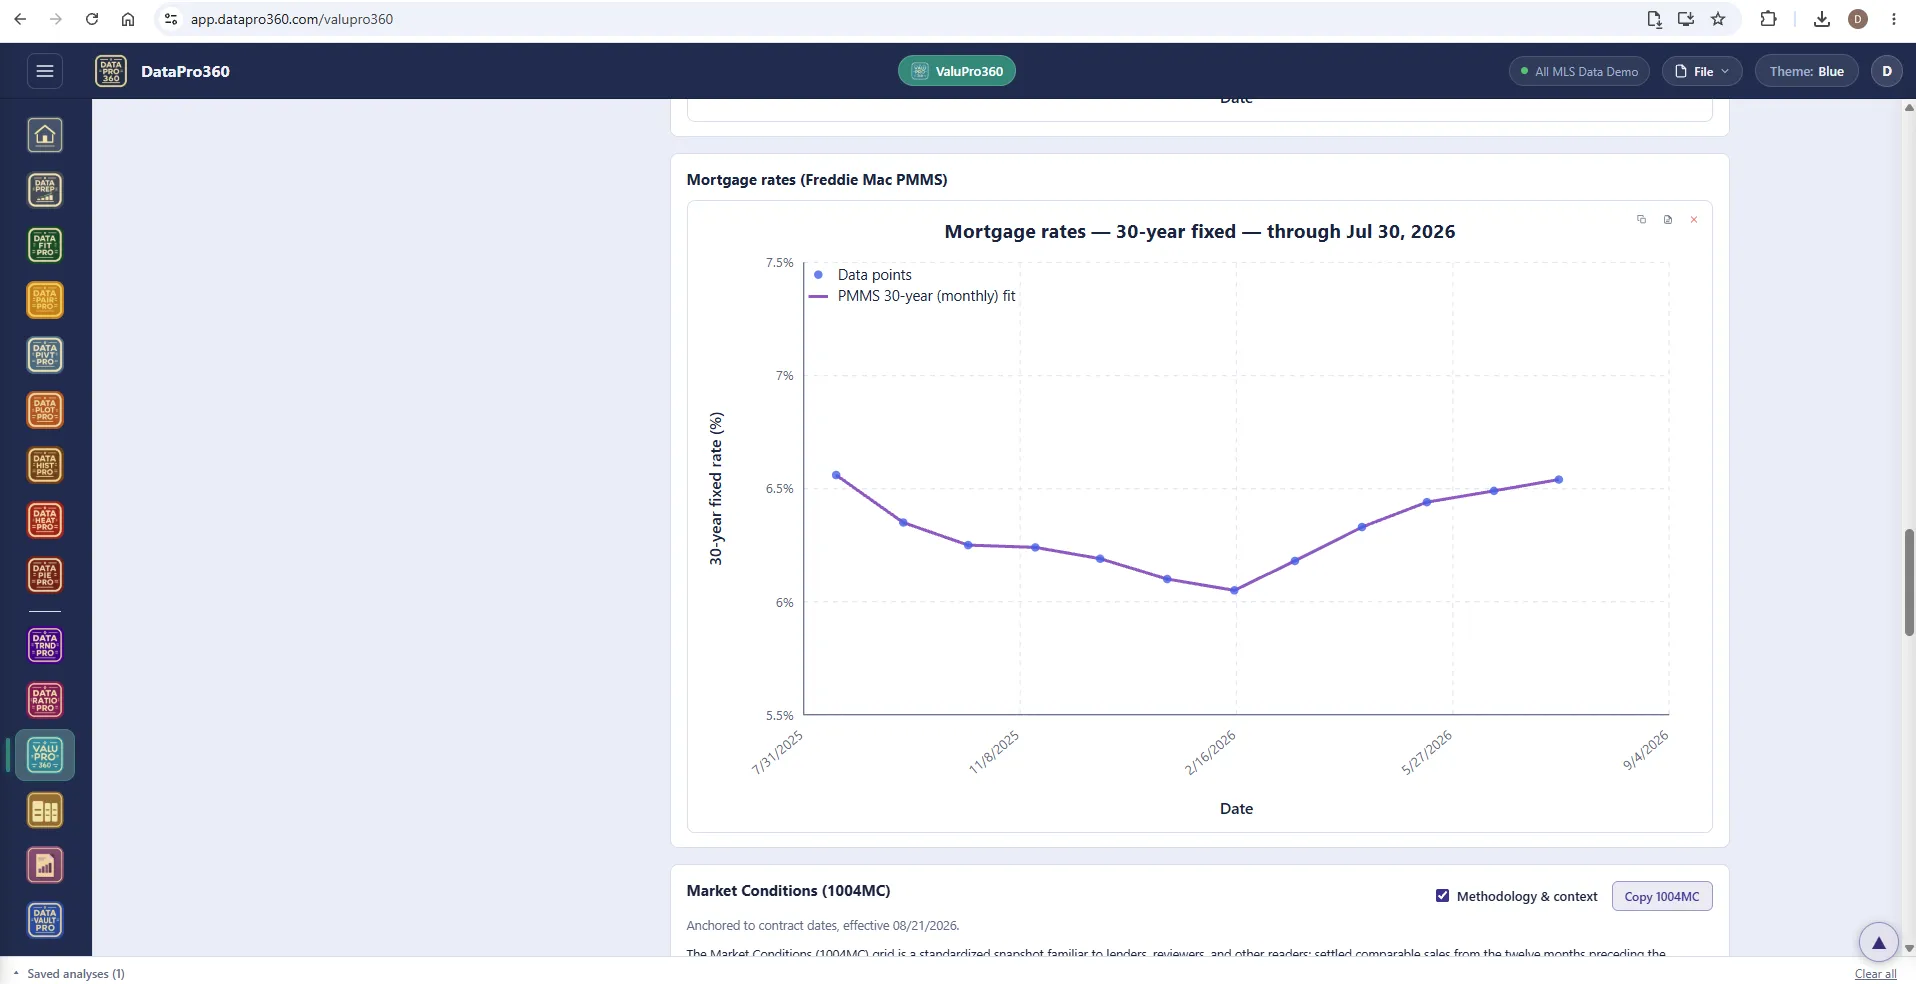
Mortgage rates — context for financing conditions.
The Freddie Mac Primary Mortgage Market Survey 30-year fixed rate, charted over the same period. Rates inform the reading of the market; they play no part in the adjustment calculation, and the narrative says so.
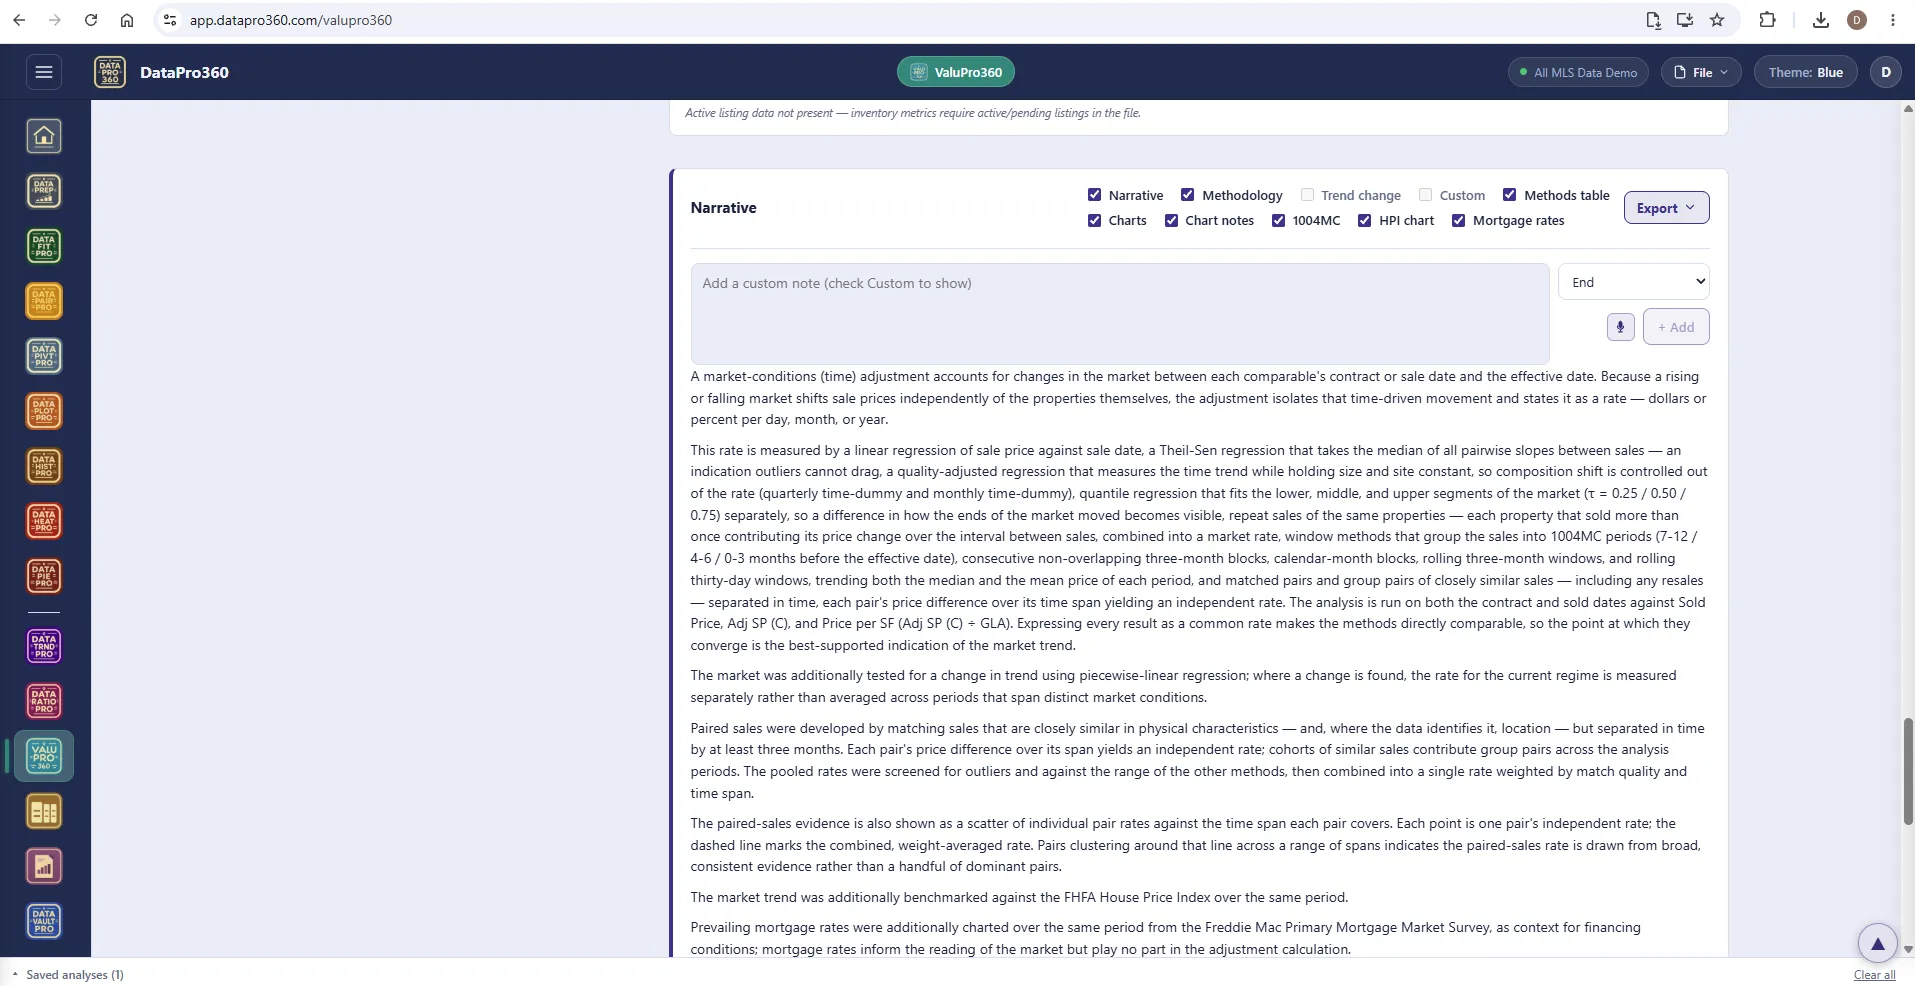
The narrative — written from the run, yours to edit.
Narrative, methodology, trend change, the methods table, charts and chart notes, the 1004MC, the HPI and mortgage-rate exhibits — each a layer you toggle. Add custom notes where they belong. The prose is generated from the analysis itself, never from a language model, so it restates exactly what the station measured.
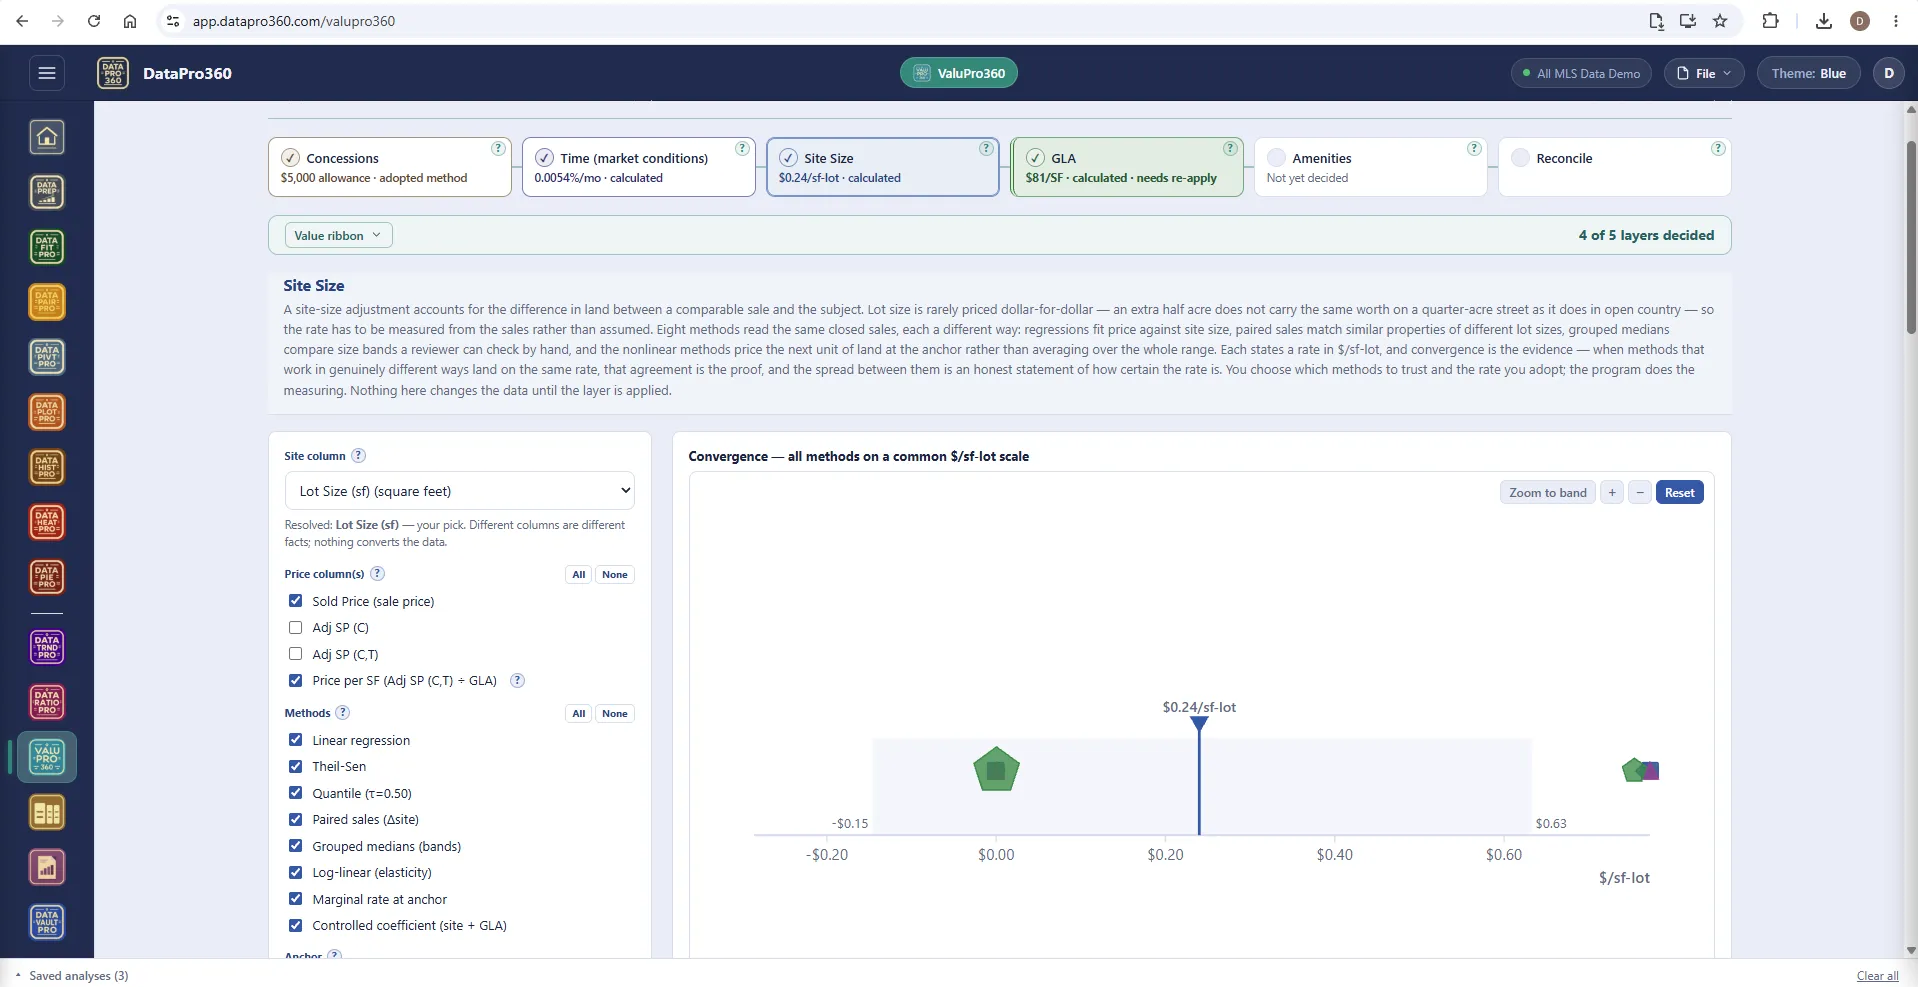
Site — what the market pays for land, at the anchor.
Lot size is rarely priced dollar-for-dollar, so the rate has to be measured from the sales rather than assumed. Eight methods read the same closed sales — regressions, paired sales, grouped medians, the nonlinear methods pricing the next unit at the anchor — and state a rate in $/sf-lot. Choose the anchor: median, mean, or the subject.
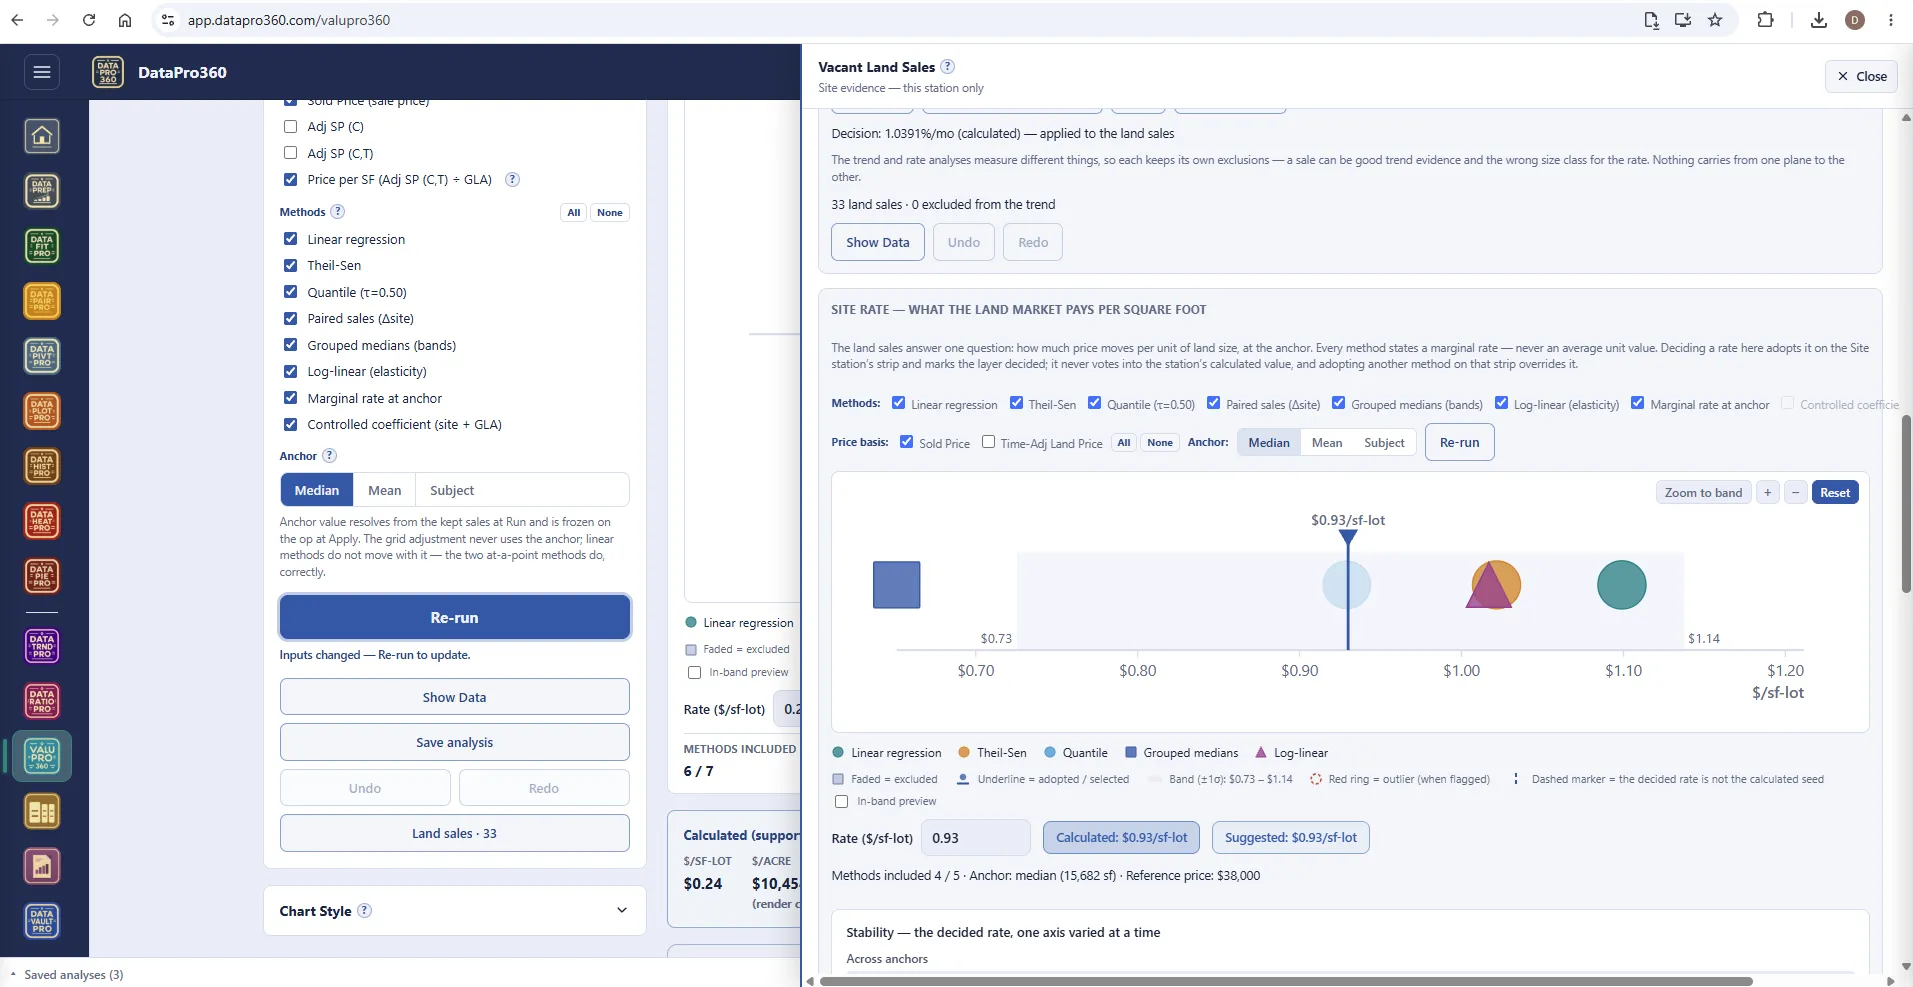
The land pool — vacant land sales as site evidence.
Where the file carries land sales, the station reads them as a separate plane of evidence: a time-adjusted land price, a marginal rate at the anchor, and a stability table that varies one axis at a time. The trend and rate analyses keep their own exclusions — a sale can be good trend evidence and the wrong size class for the rate.
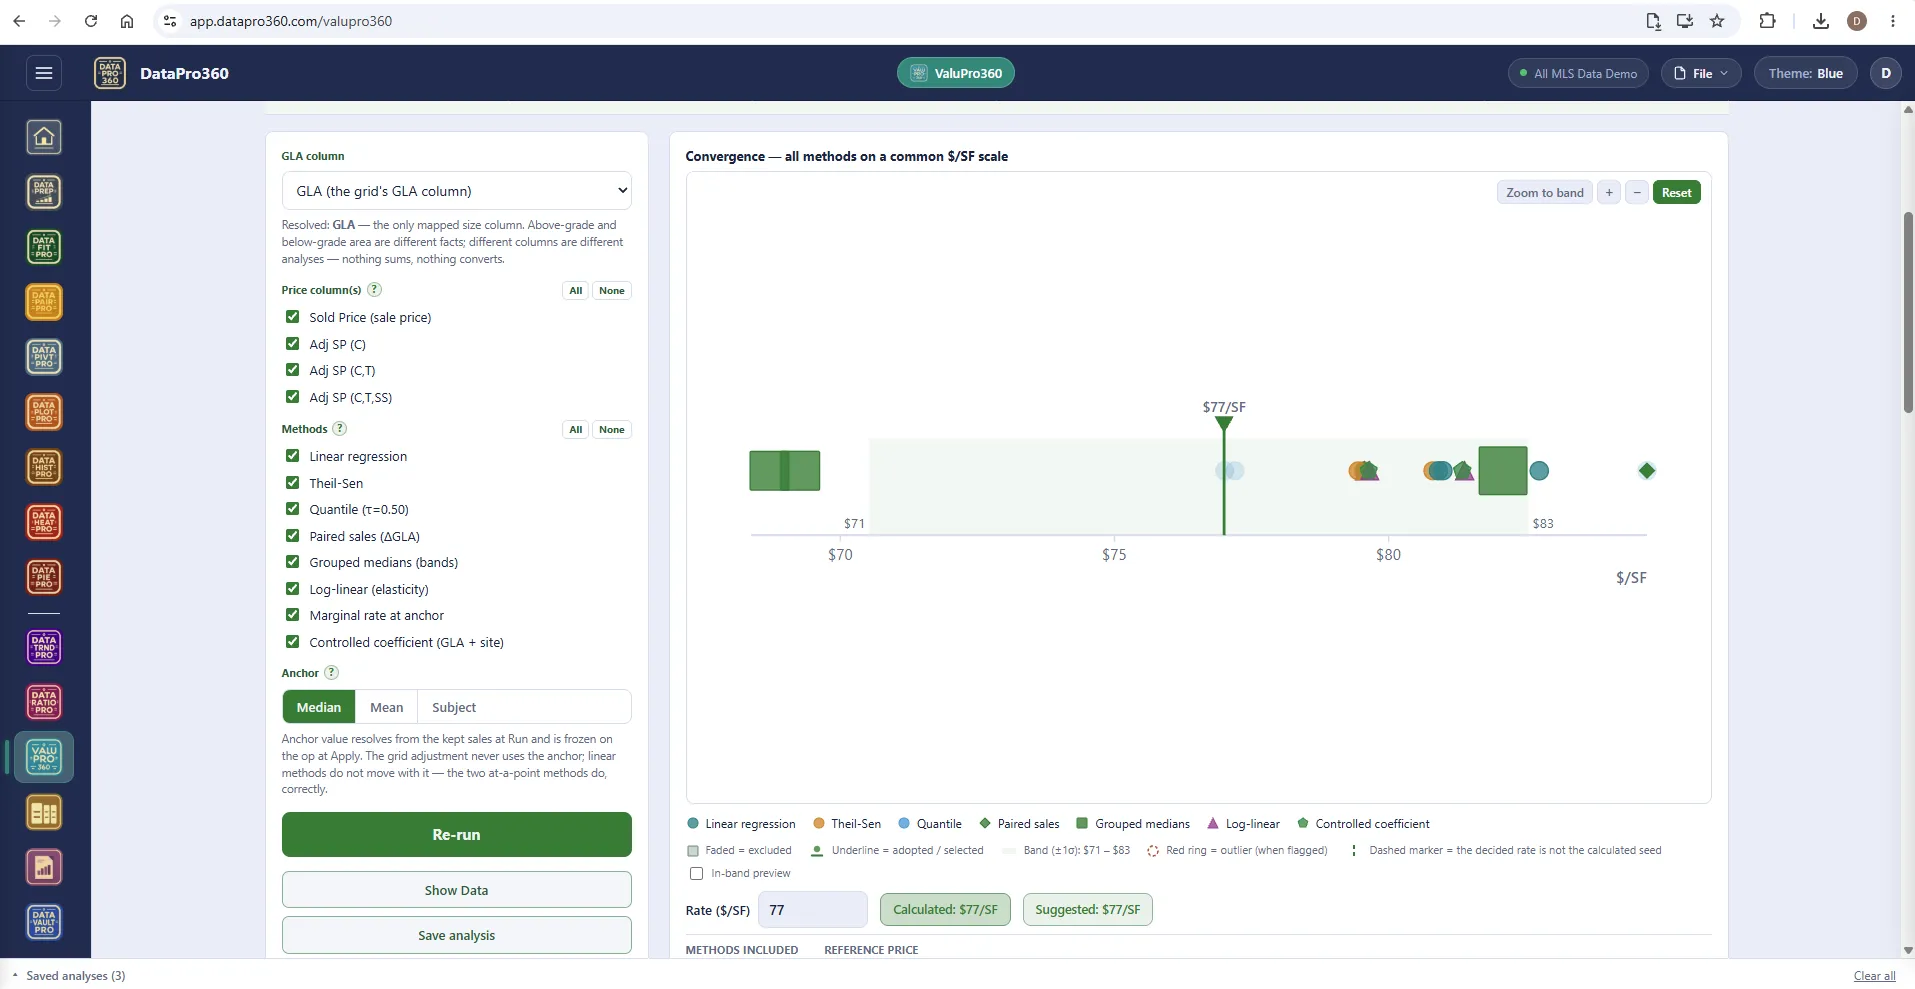
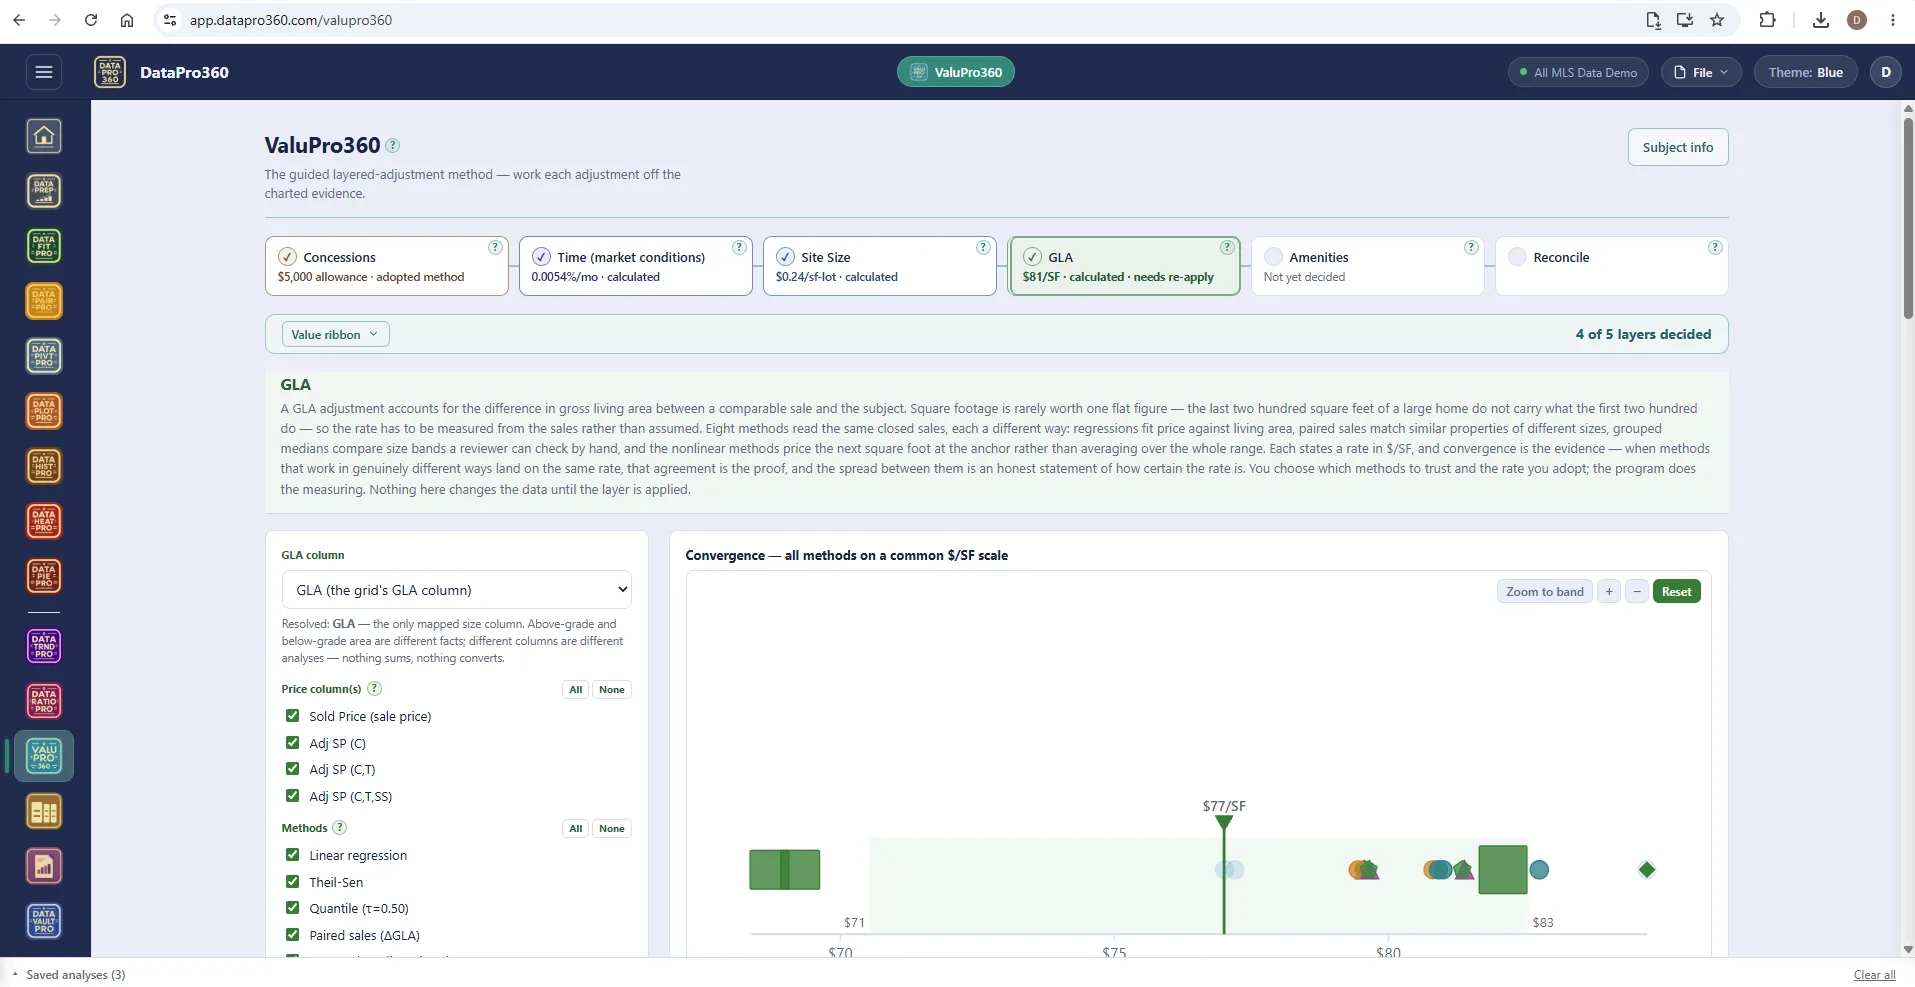
GLA — why the rate is smaller than $/SF.
Divide sale price by living area and you get a figure that includes the lot, the kitchen, the roof, the garage — everything, divided by square footage. The GLA adjustment is the marginal rate: what one more square foot adds, holding the rest constant. By this station concessions, time and site are already out, so a $228-per-square-foot market can carry a GLA rate in the $30 to $80 range, and both numbers are right.
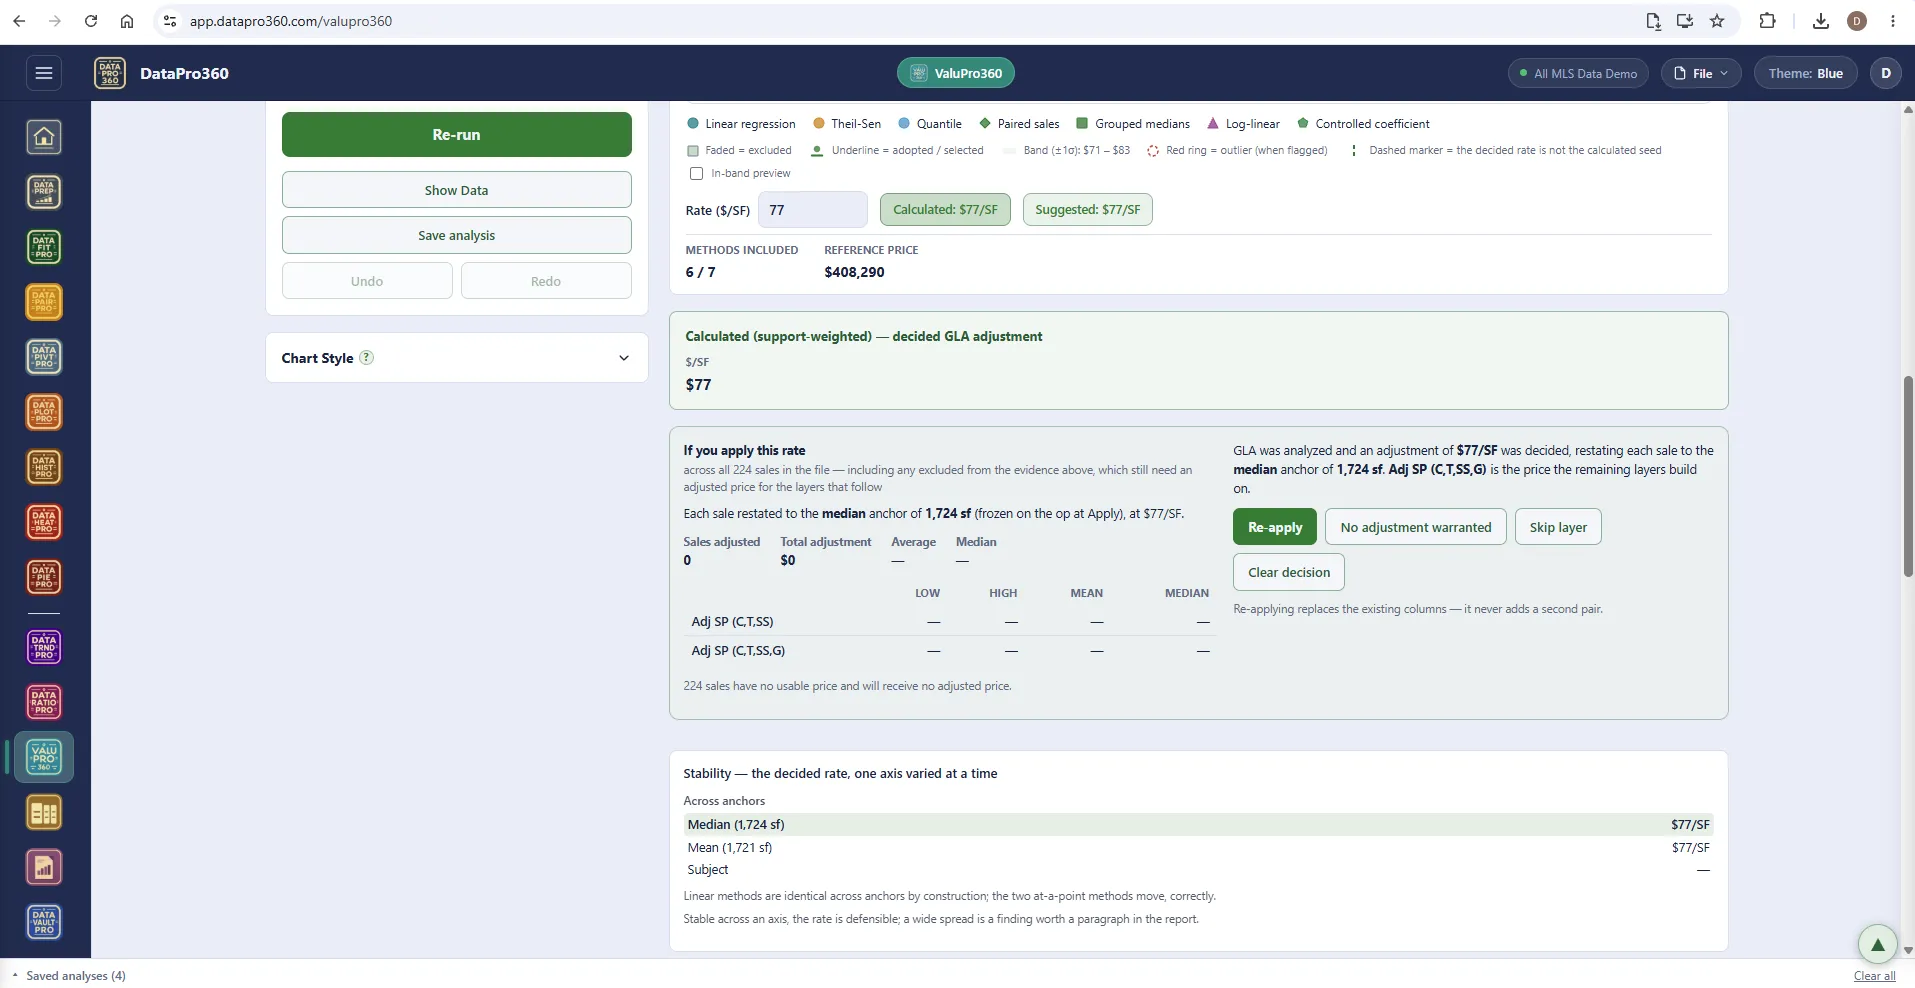
Apply — and the next layer builds on it.
Applying restates every sale to the anchor at the decided rate and writes the adjusted column the remaining layers build on. Re-apply replaces the existing columns rather than adding a second pair; No adjustment warranted and Skip layer are decisions too, recorded as such. Nothing changes the data until you apply.
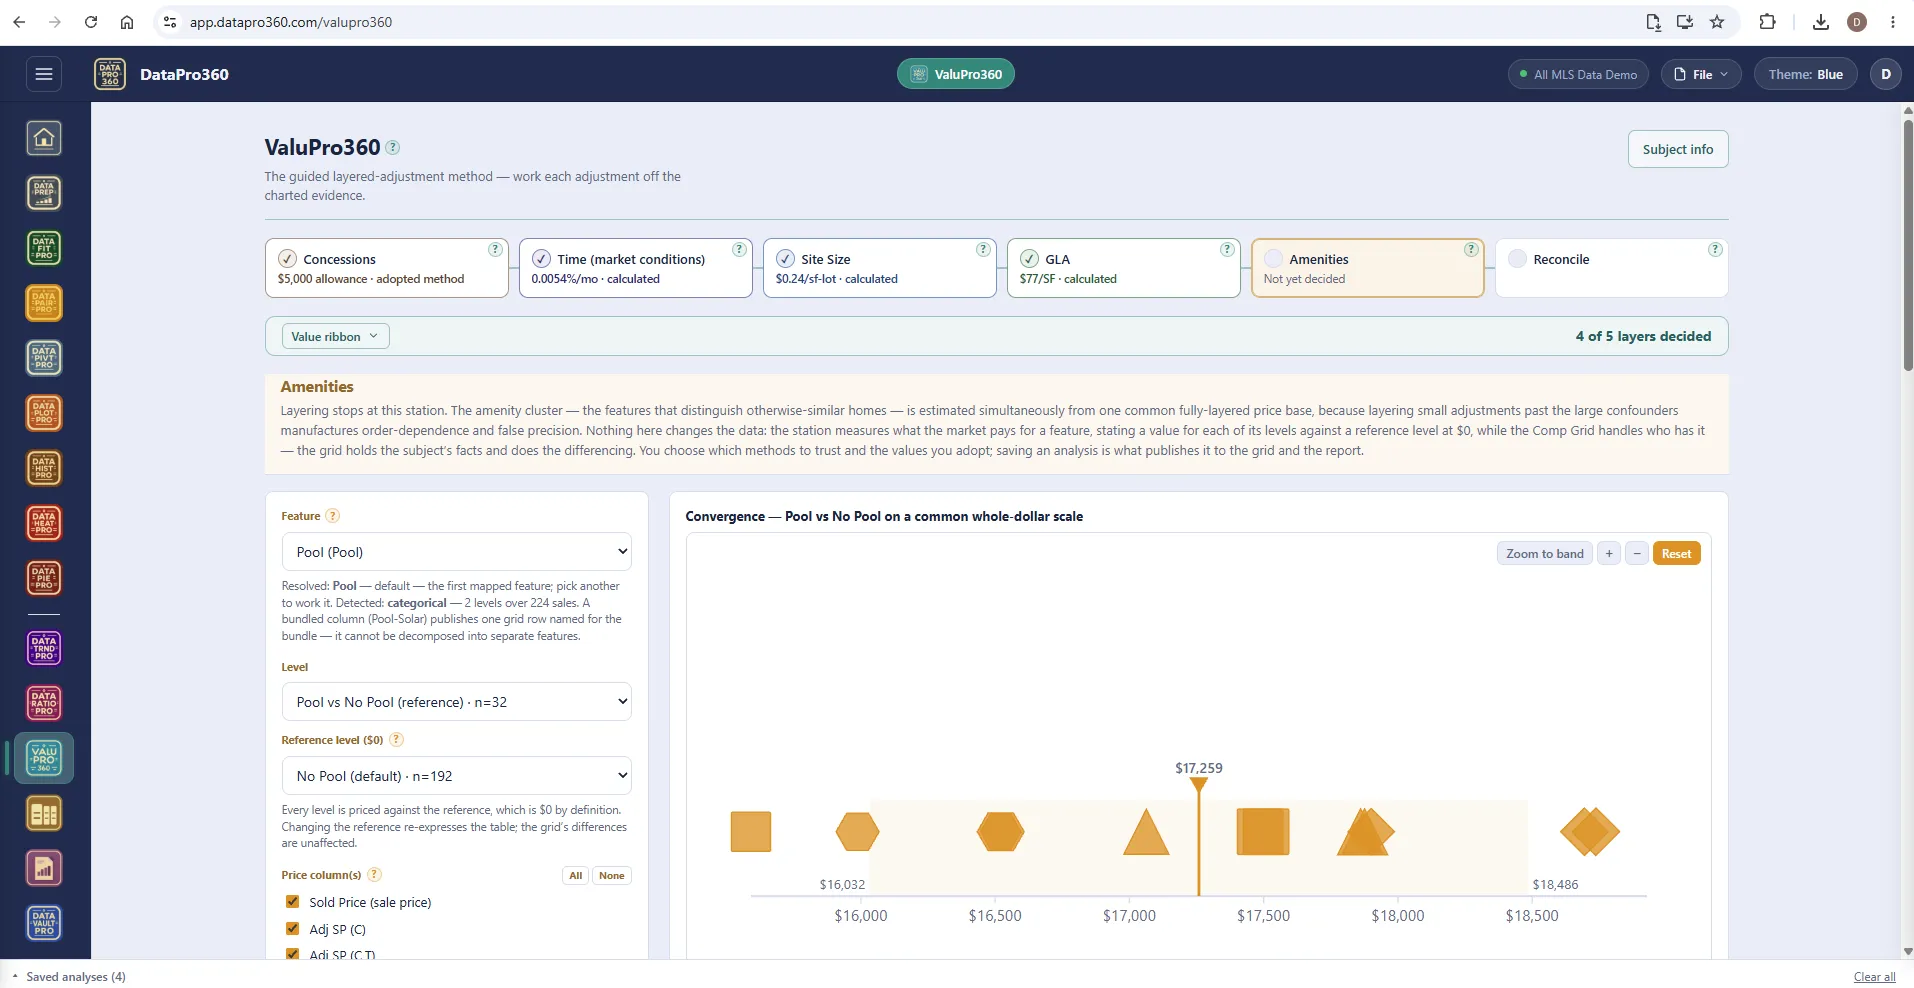
Amenities — the cluster, solved together.
Layering stops here. The amenity cluster is estimated simultaneously from one common fully-layered price base, because layering small adjustments past each other manufactures order-dependence and false precision. Each feature is priced per level against a reference level at $0; the Comp Grid holds the subject's facts and does the differencing.
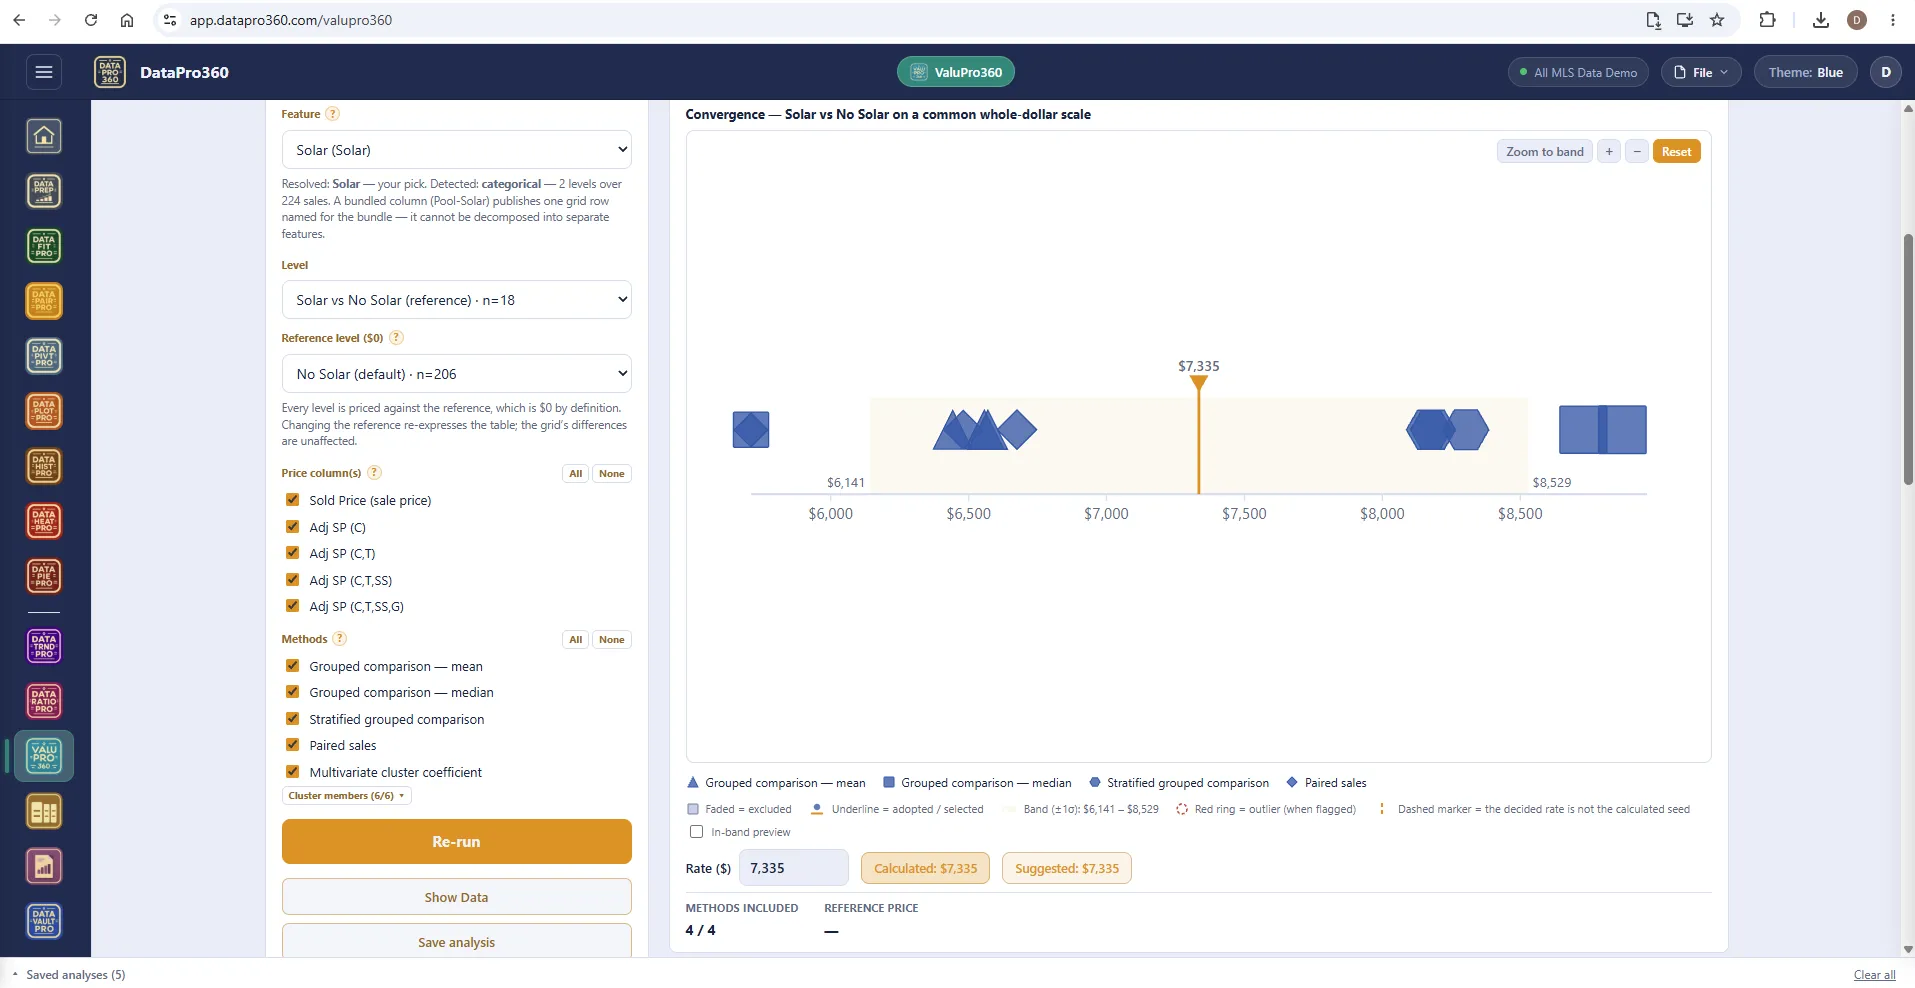
Every feature, every base, every method.
Grouped comparison by mean and median, stratified grouped comparison, paired sales, and a multivariate cluster coefficient — run across Sold Price and each adjusted base. Solar, pool, shop, garage: the same surface, the same evidence, one decision per feature.
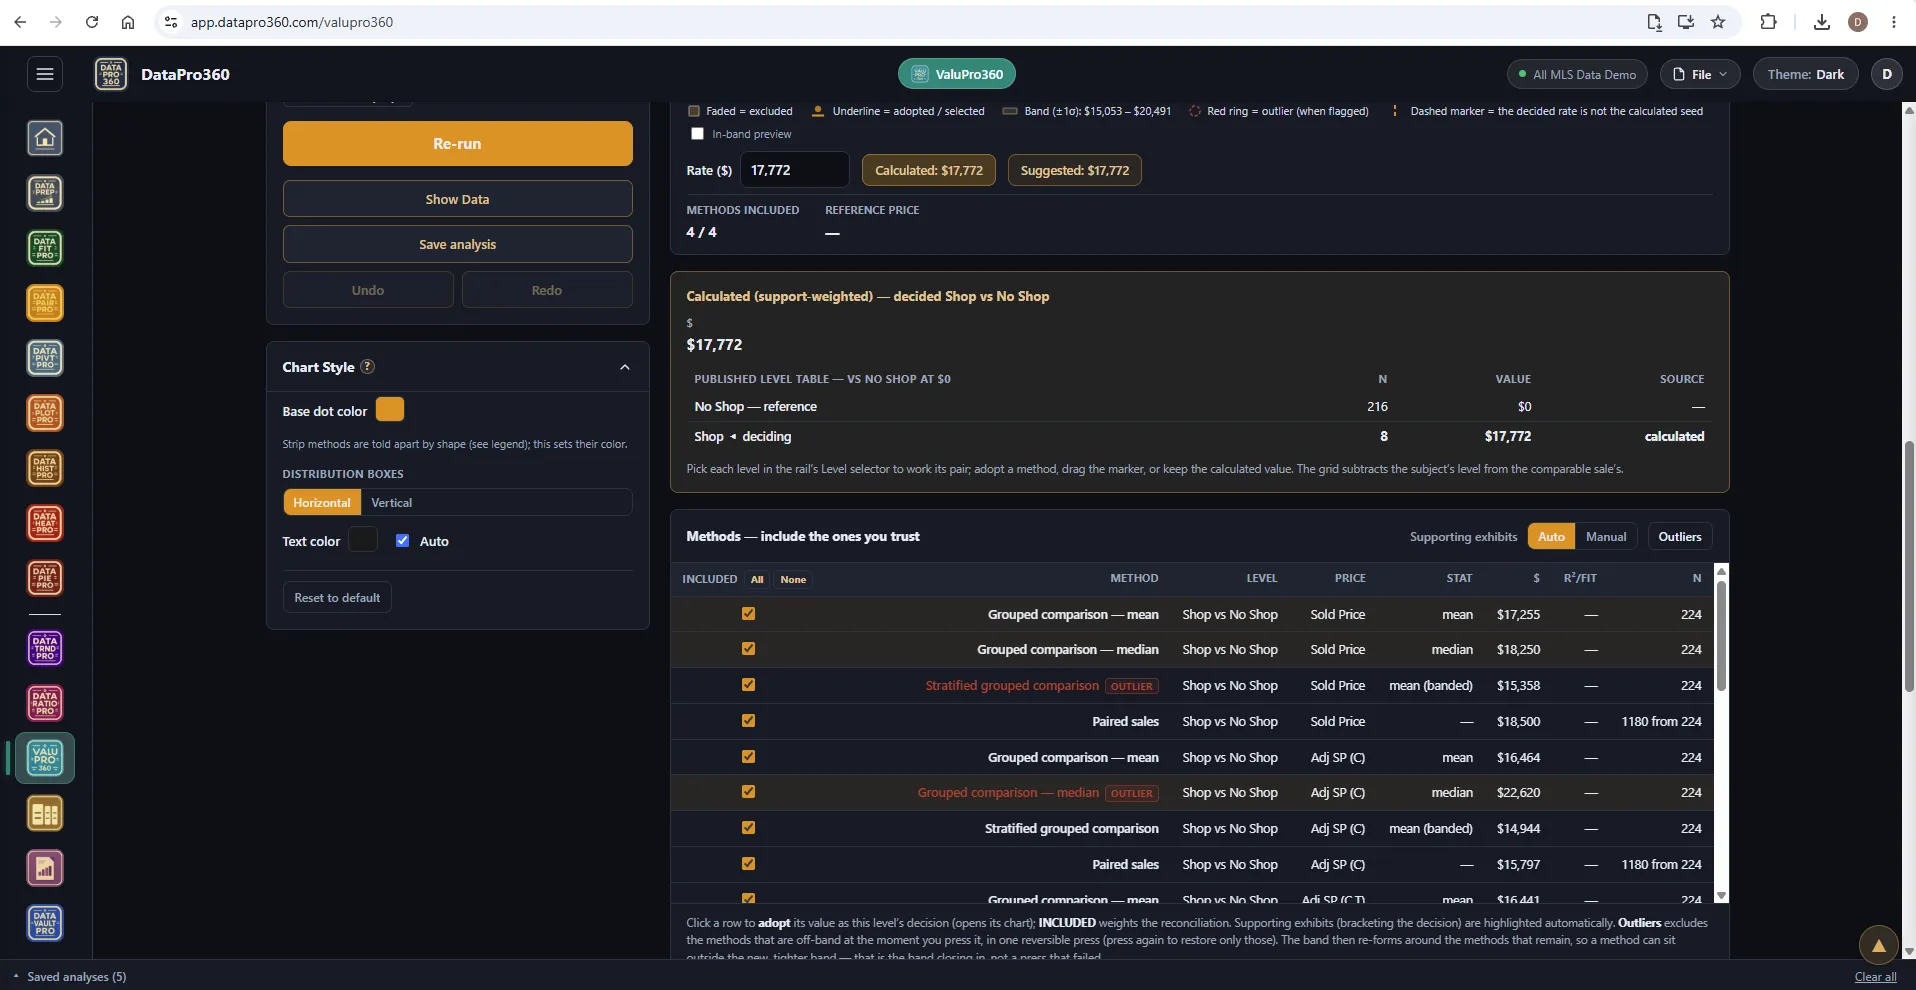
The methods, on the table — in the Dark theme.
The published level table states the reference and the deciding level with their n and value; the methods table lists every method with its level, price base, statistic and result, and flags the outliers instead of hiding them. Include the ones you trust; the calculated value is support-weighted across them.
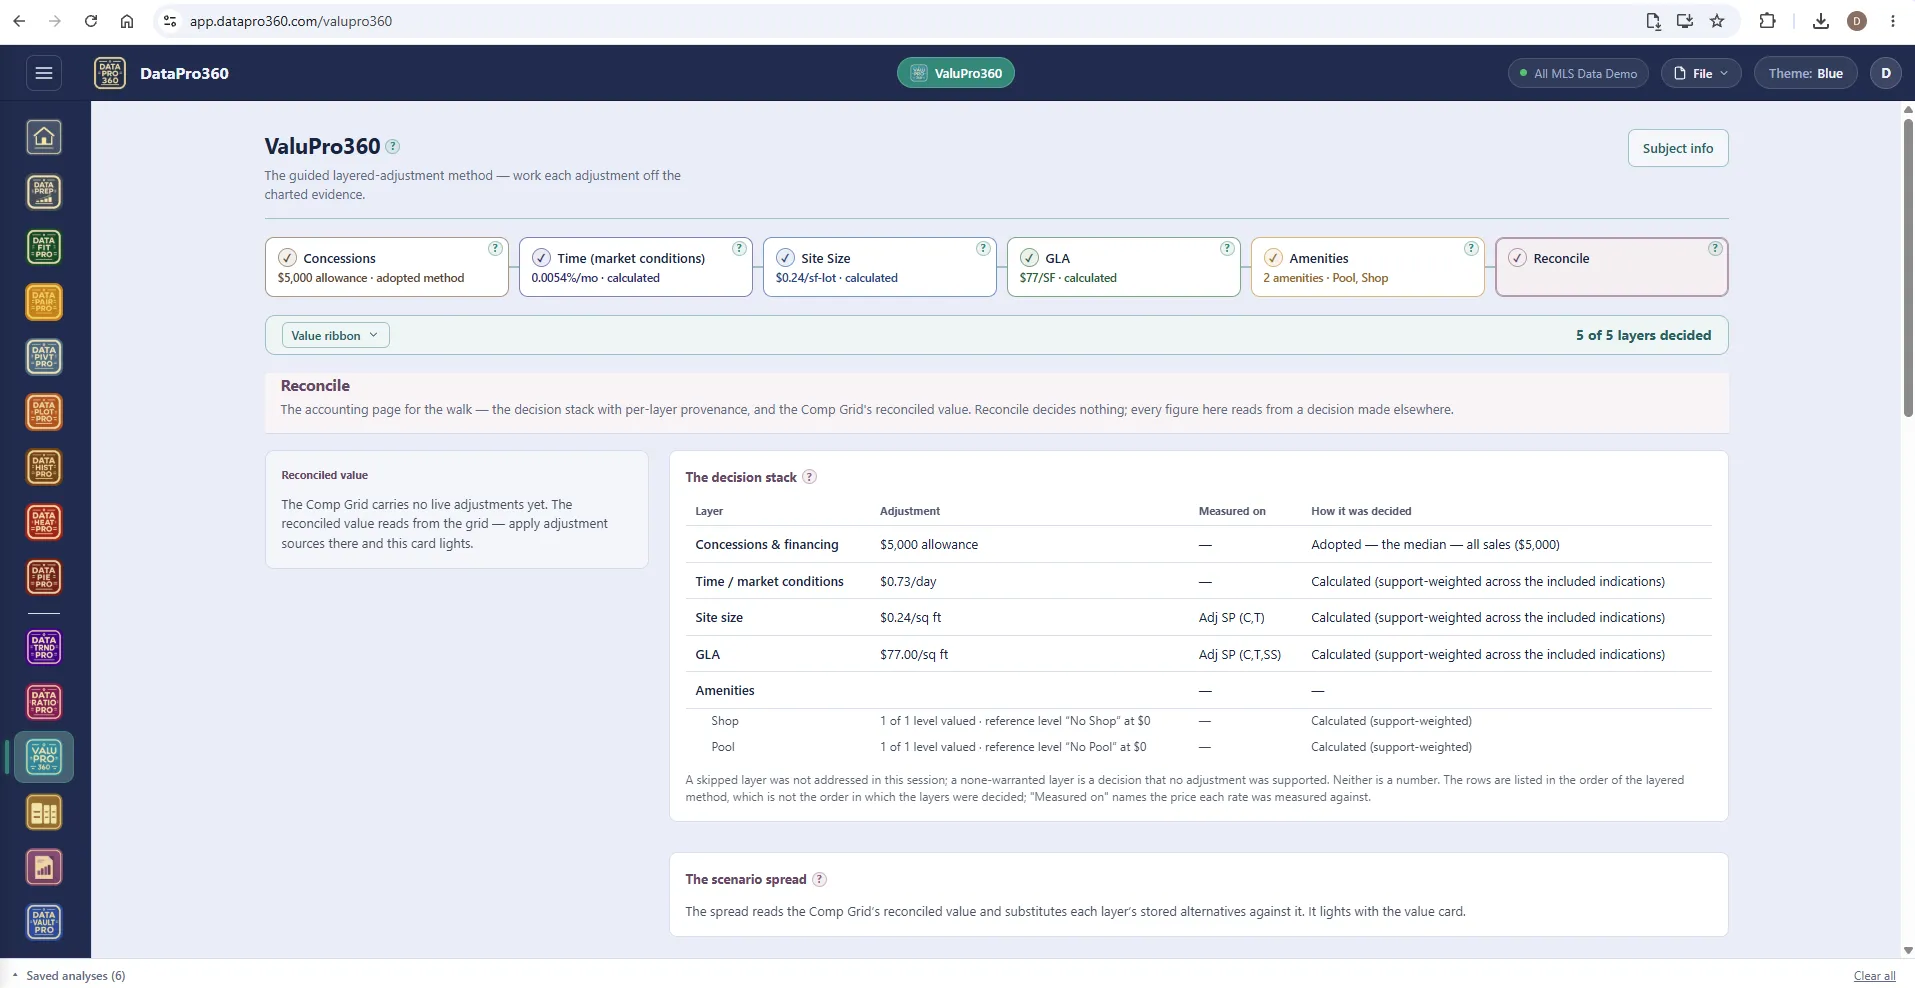
Reconcile — the decision stack.
Reconcile decides nothing; every figure reads from a decision made elsewhere. The decision stack lists each layer, its adjustment, the price it was measured on and how it was decided — adopted, calculated, skipped, none warranted. The scenario spread lays the reconciled value under each stored alternative side by side, so the cost of choosing among defensible readings is visible.
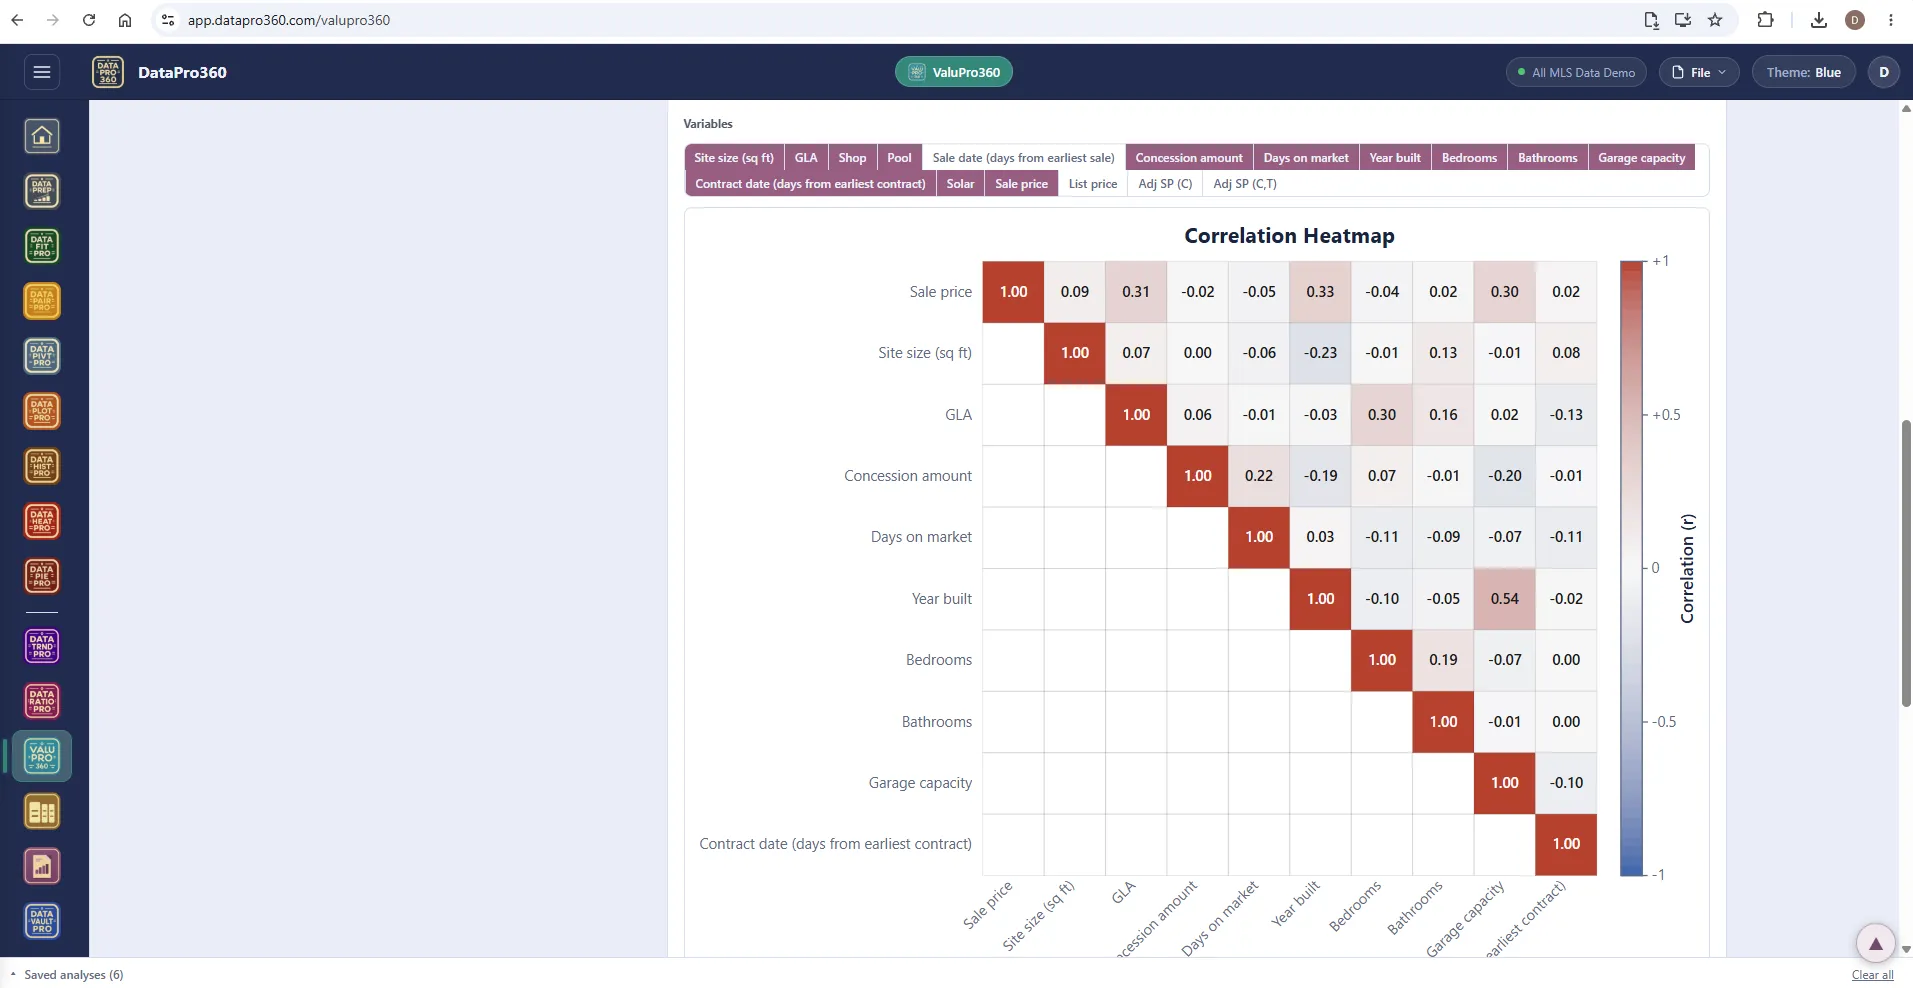
The correlation check.
A correlation heat map across the variables in play — site, GLA, the features, dates, concessions, days on market, the price bases — so a confounder that would have leaked into a feature's value is visible before the grid is built.
Where it sits
In the workflow
ValuPro360 reads the prepared dataset and publishes each decided layer to the Comp Grid. Saved station analyses carry into Report Manager as sections — chart, narrative and methods table together.
See the whole workflow →Before
 DataPrep
 DataTrndPro
After
 Comp Grid
 Report Manager
Prove the numbers in your next report.
Load your own MLS export and work a real assignment through the trial — every chart, every method, the finished report.
$69.95 per user, per month. 30-day free trial, no credit card required. No long-term contract.