
DataPrep
Where a loaded file becomes a working dataset — without touching the original.
Clean and prepare your data — filter rows, rename columns, apply transforms.
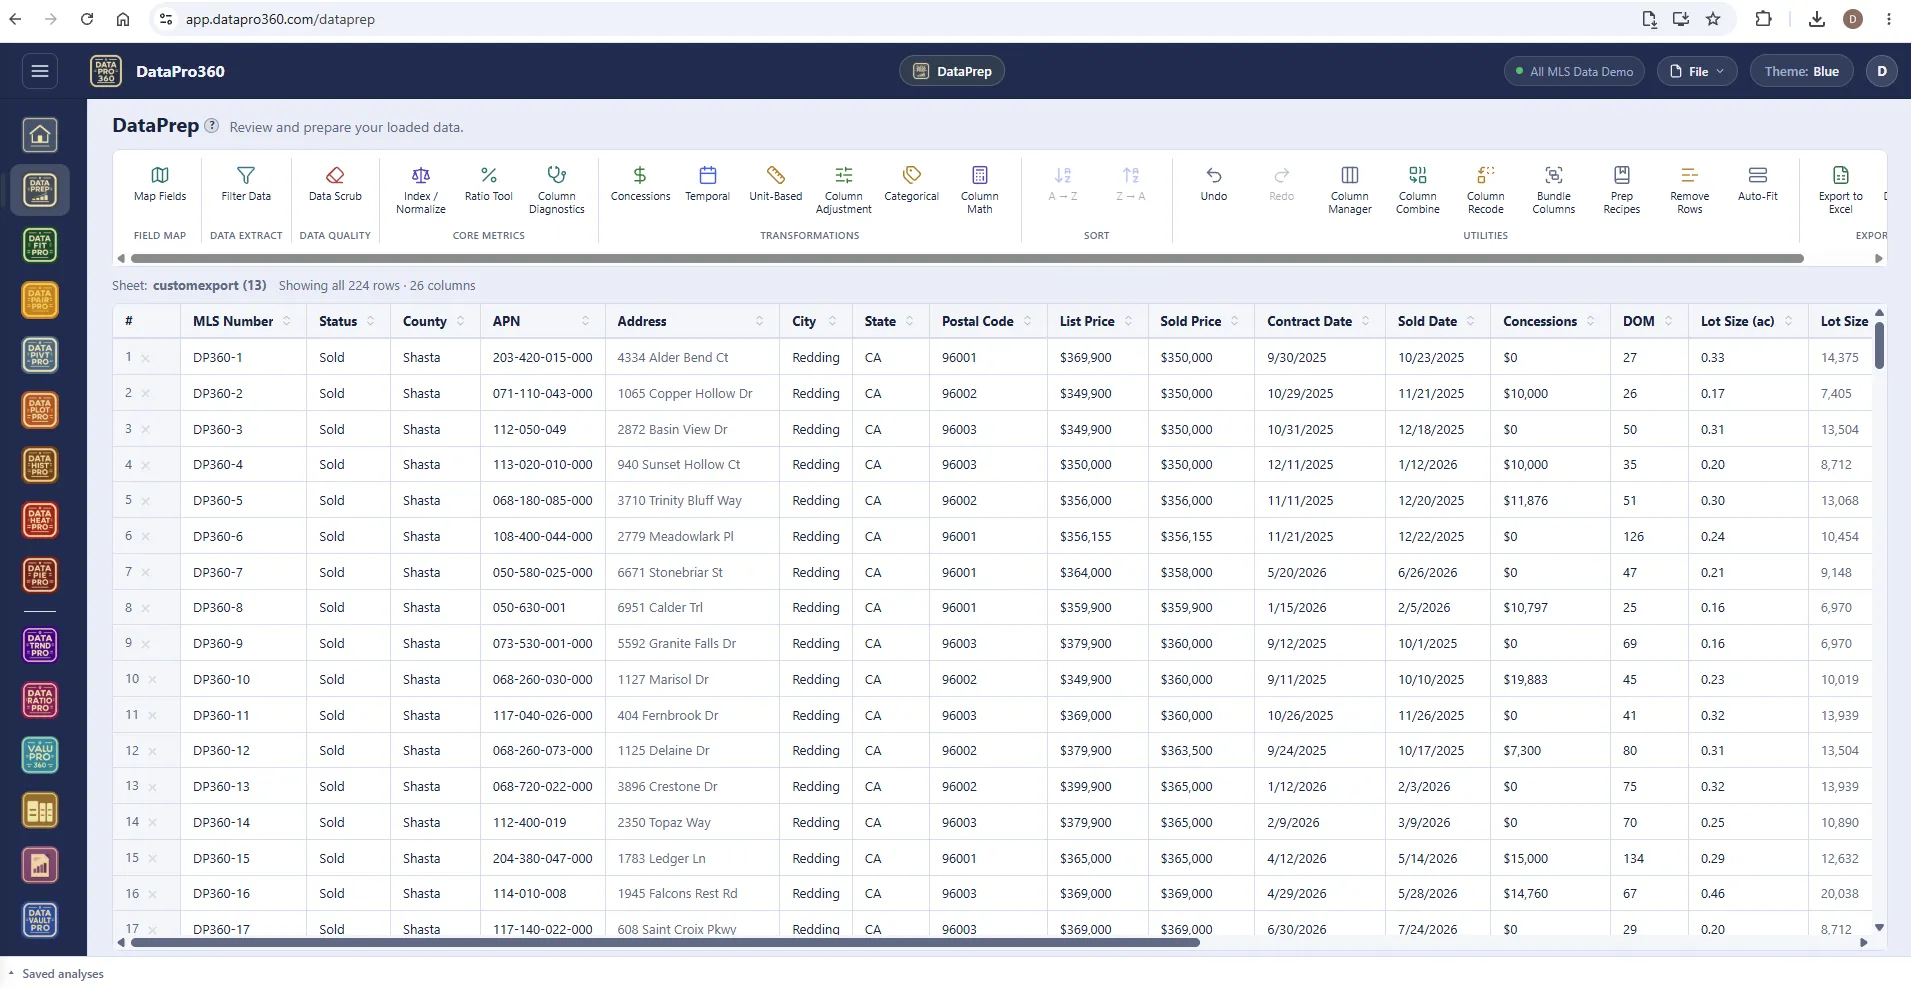
What it does
DataPrep is where a loaded file becomes a working dataset. It reads your spreadsheet as it arrived and gives you the tools to shape it without touching the original: filter the rows down to the set you mean to analyze, hide or rename columns, and apply transforms to build the columns the analysis needs. Every change lives in the session and travels with the saved file — the file on disk is never modified.
Work here pays off everywhere downstream. The columns you prepare and the roles you map in Map Fields are what every other surface reads: the tools chart what DataPrep prepared, and the ValuPro360 stations solve against the bases it built. Map Fields tags each column with its role — sale price, sold date, living area, site size — and the values stay exactly as they were.
The order that avoids the most rework: confirm what you exported, filter out the statuses and property types that do not belong, scrub whitespace, text-stored numbers and duplicates, recode inconsistent values so they group correctly, then map the roles and compute the derived columns — price per square foot, age, anything derived. Scrub and recode before mapping, because a mapped column with inconsistent values hands the inconsistency to every downstream grouping.
A recipe records the steps you applied, so when next month's export arrives with the same shape the same preparation re-runs in order instead of being rebuilt by hand. Undo and redo cover every step, and the transformation log states what was done.
- Map Fields · Filter Data · Data Scrub
- Index / Normalize · Ratio Tool · Column Diagnostics
- Concessions, Temporal, Unit-Based, Column and Categorical adjustments
- Column Math · Column Combine · Column Recode · Bundle Columns
- Column Manager · Remove Rows · Prep Recipes
- Undo / Redo · Export to Excel
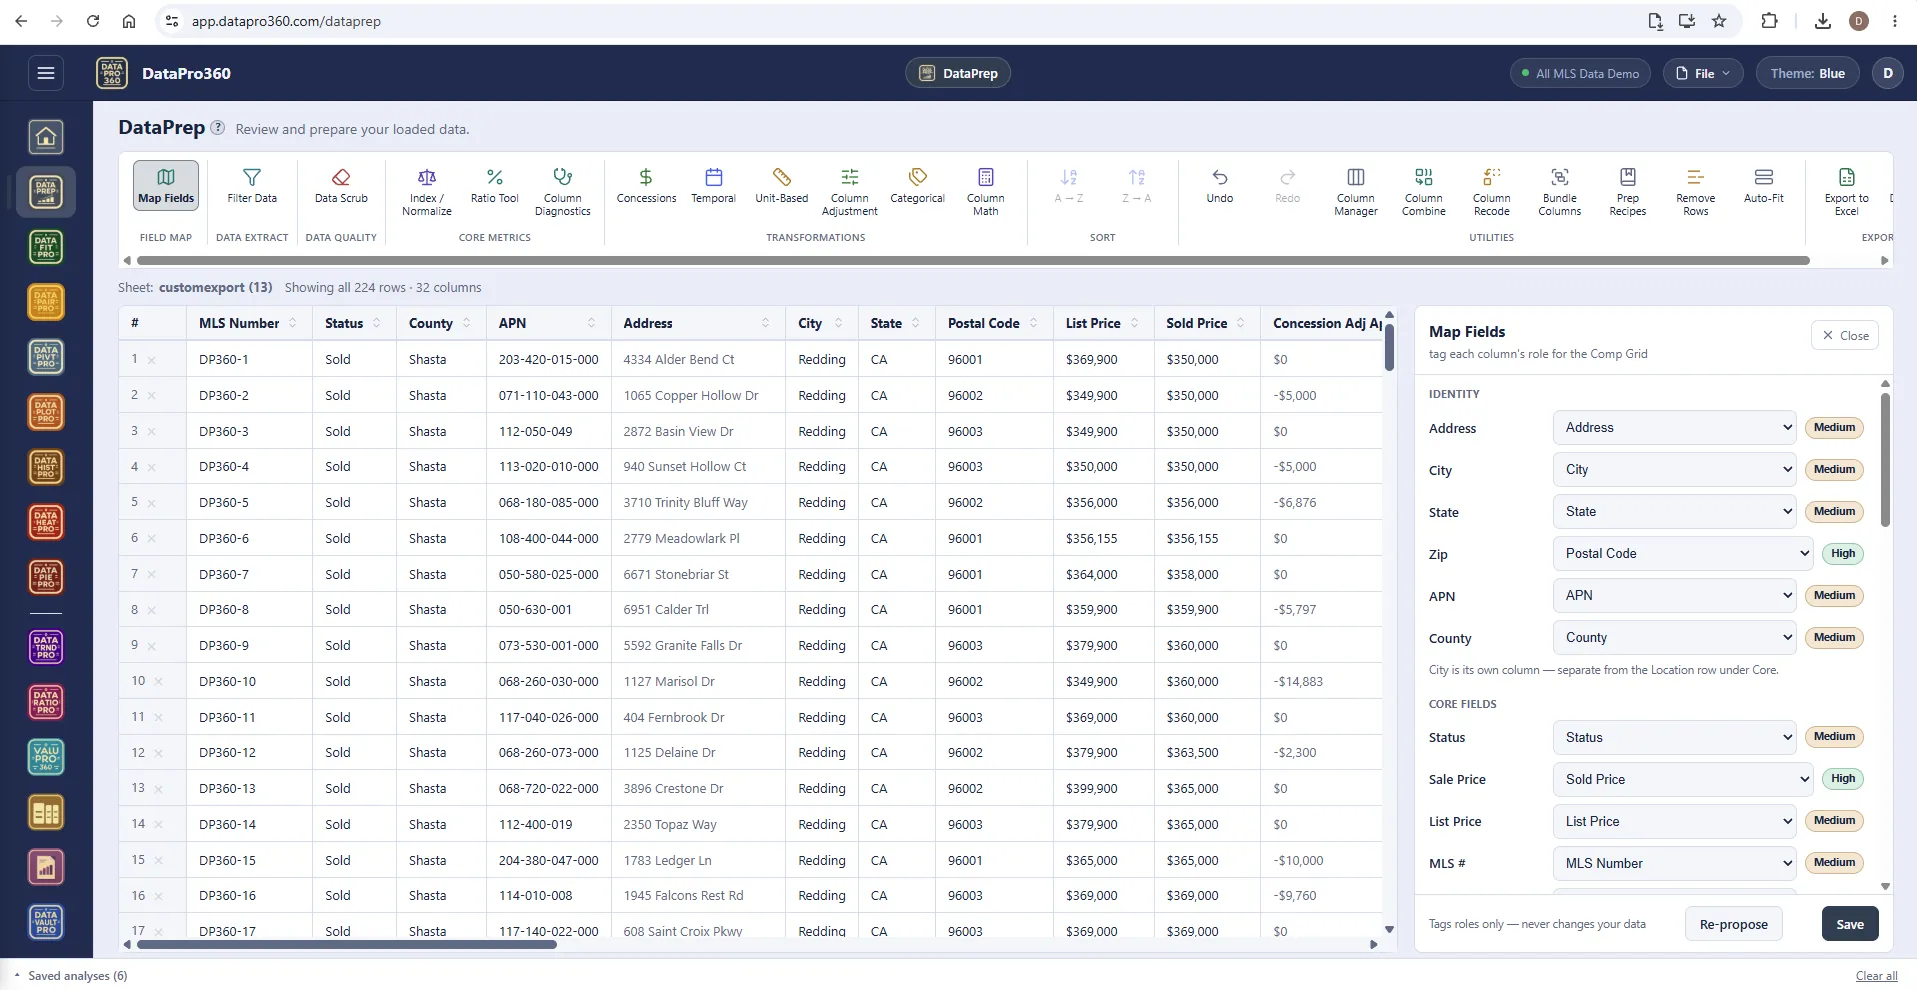
Map Fields — tag each column's role.
The program proposes a mapping by reading your column names, and it is usually close. Confirm the sale price, the dates, living area and site size — a wrong mapping is silent and propagates everywhere, so this is the one step worth being slow about. Mapping never changes your data; it unlocks the methods that need a property identifier or a quality field, and the Comp Grid builds its rows from the mapped roles.
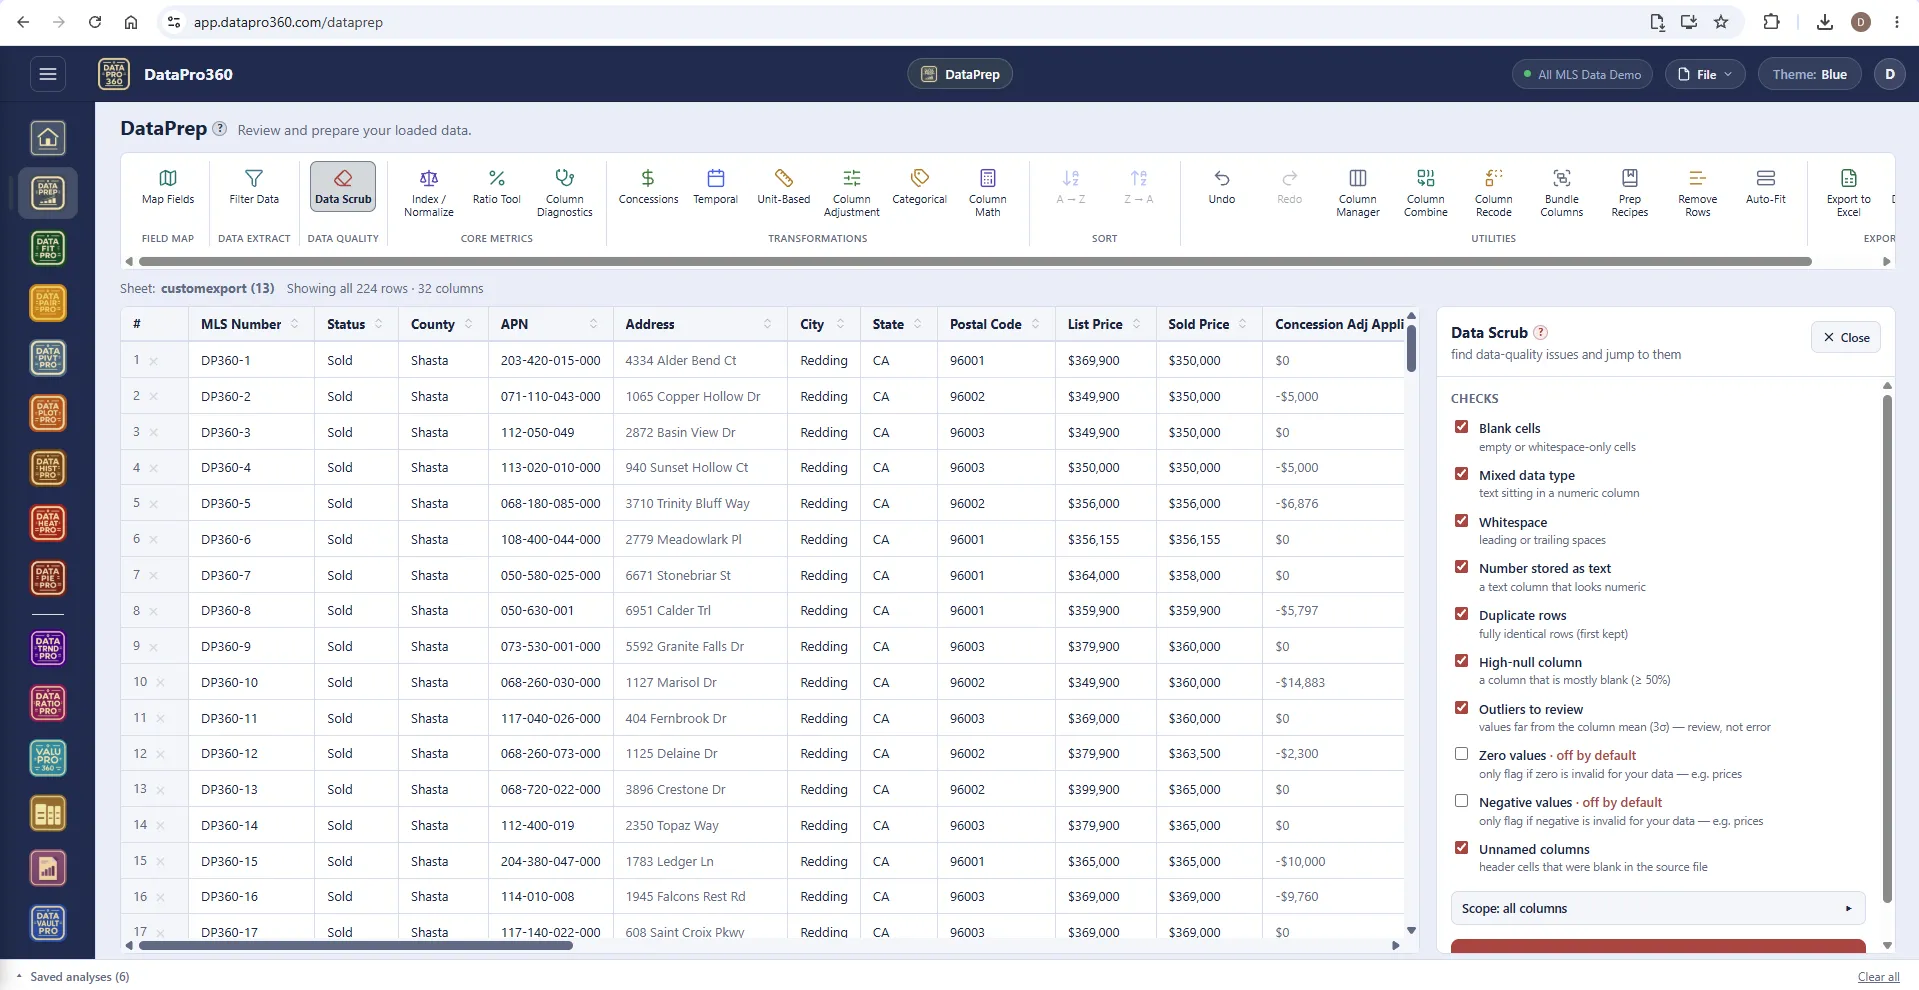
Data Scrub — find the quality issues and jump to them.
Blank cells, text sitting in a numeric column, leading or trailing whitespace, numbers stored as text, fully duplicate rows, columns that are mostly blank, outliers to review, unnamed columns. Scan first, look at what it found, then fix — the scrub reports; it does not silently rewrite.
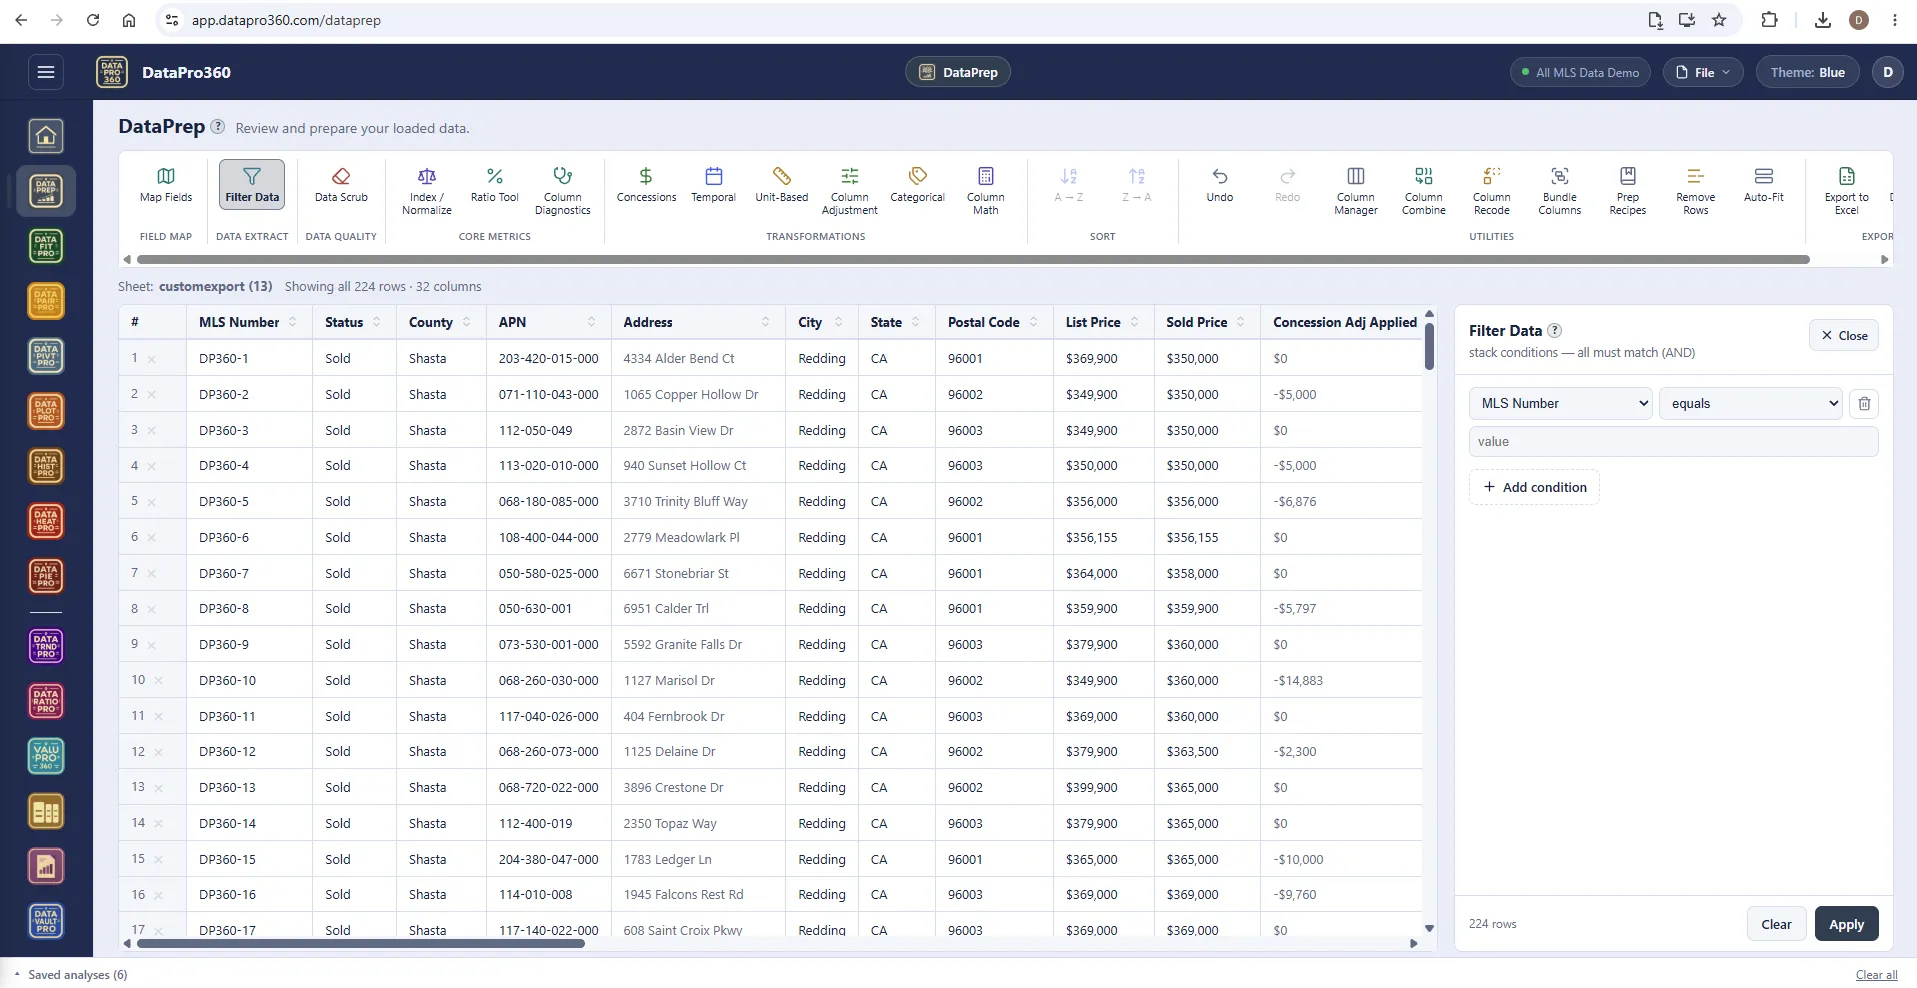
Filter Data — closed sales, this market, this window.
Filters keep or drop rows by conditions on their values, and the conditions stack: status equals Closed, sale price between two numbers, sold date after a given day, expressed as one filter. Filter early, so everything after it operates on less data and fewer surprises. A filter removes rows from every surface; an exclusion in Show Data removes one sale from one measurement only — two different acts.
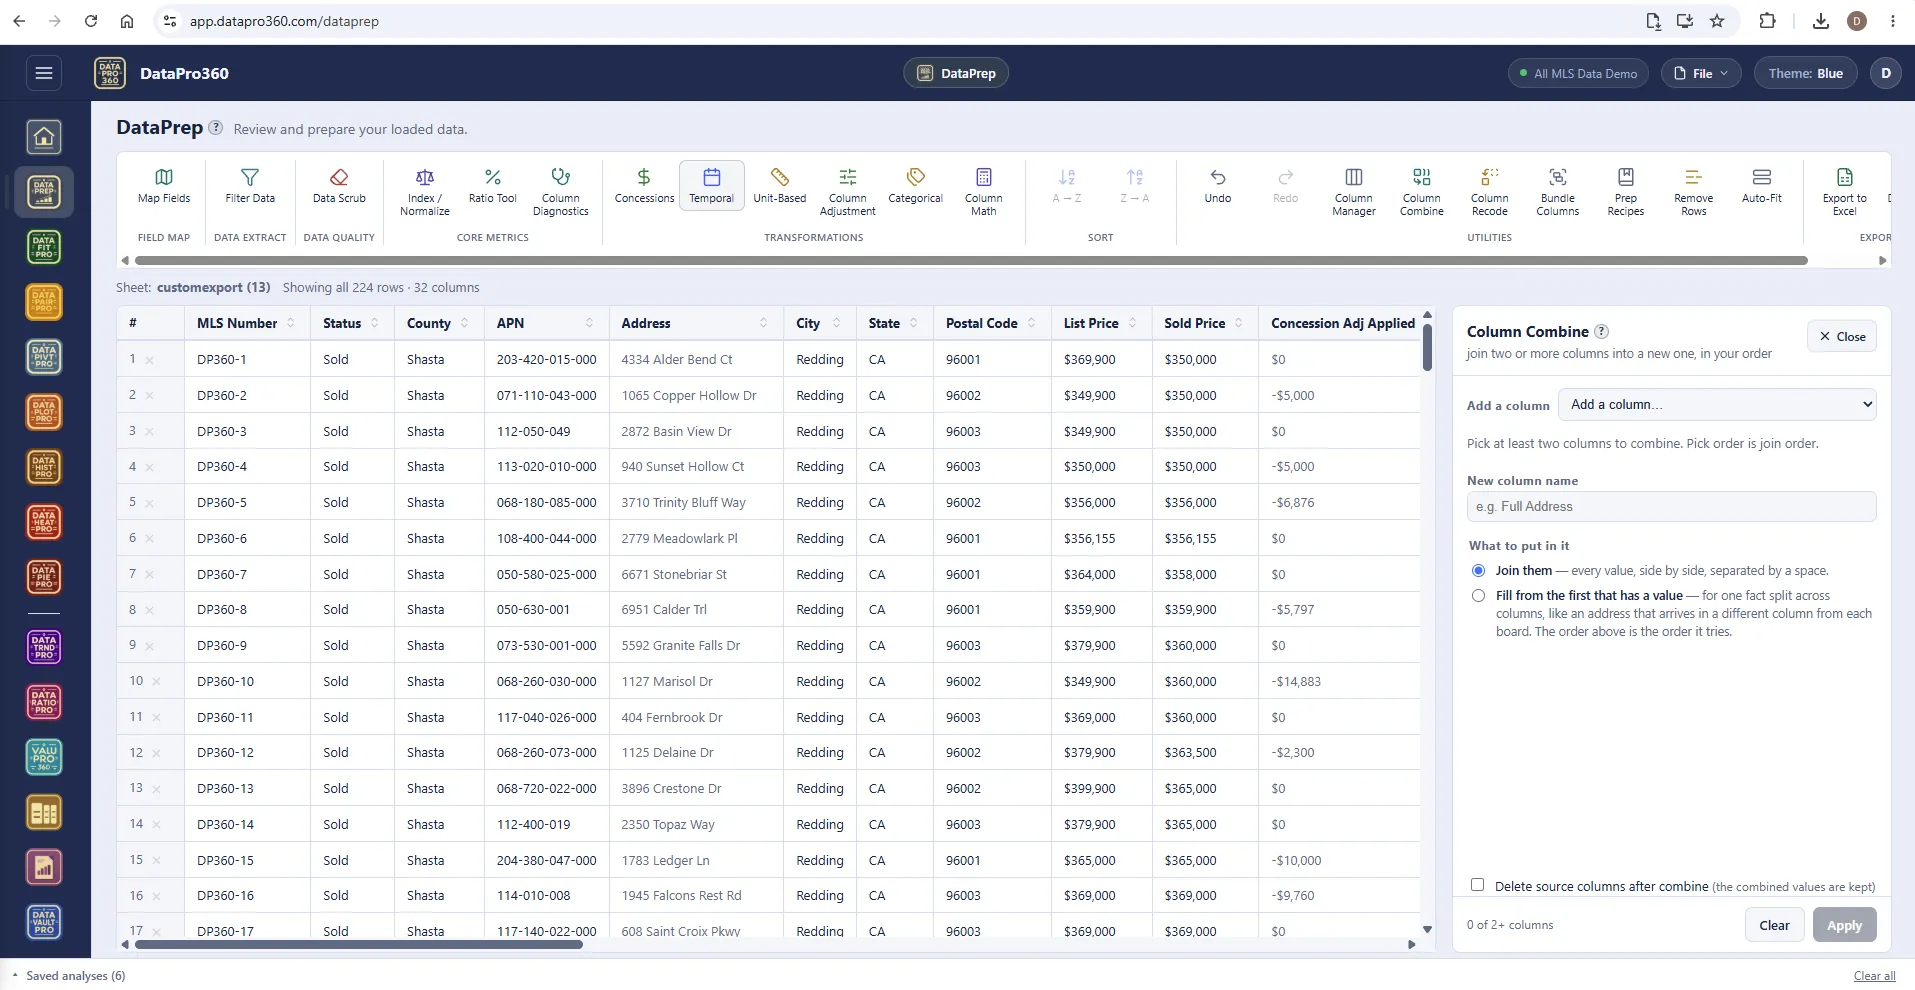
Column Combine — one fact split across columns.
Join street number, name and unit into a single address, or fill from the first column that has a value — for the fact that arrives in a different column from each board. Pick order is join order, and the source columns can stay or go.
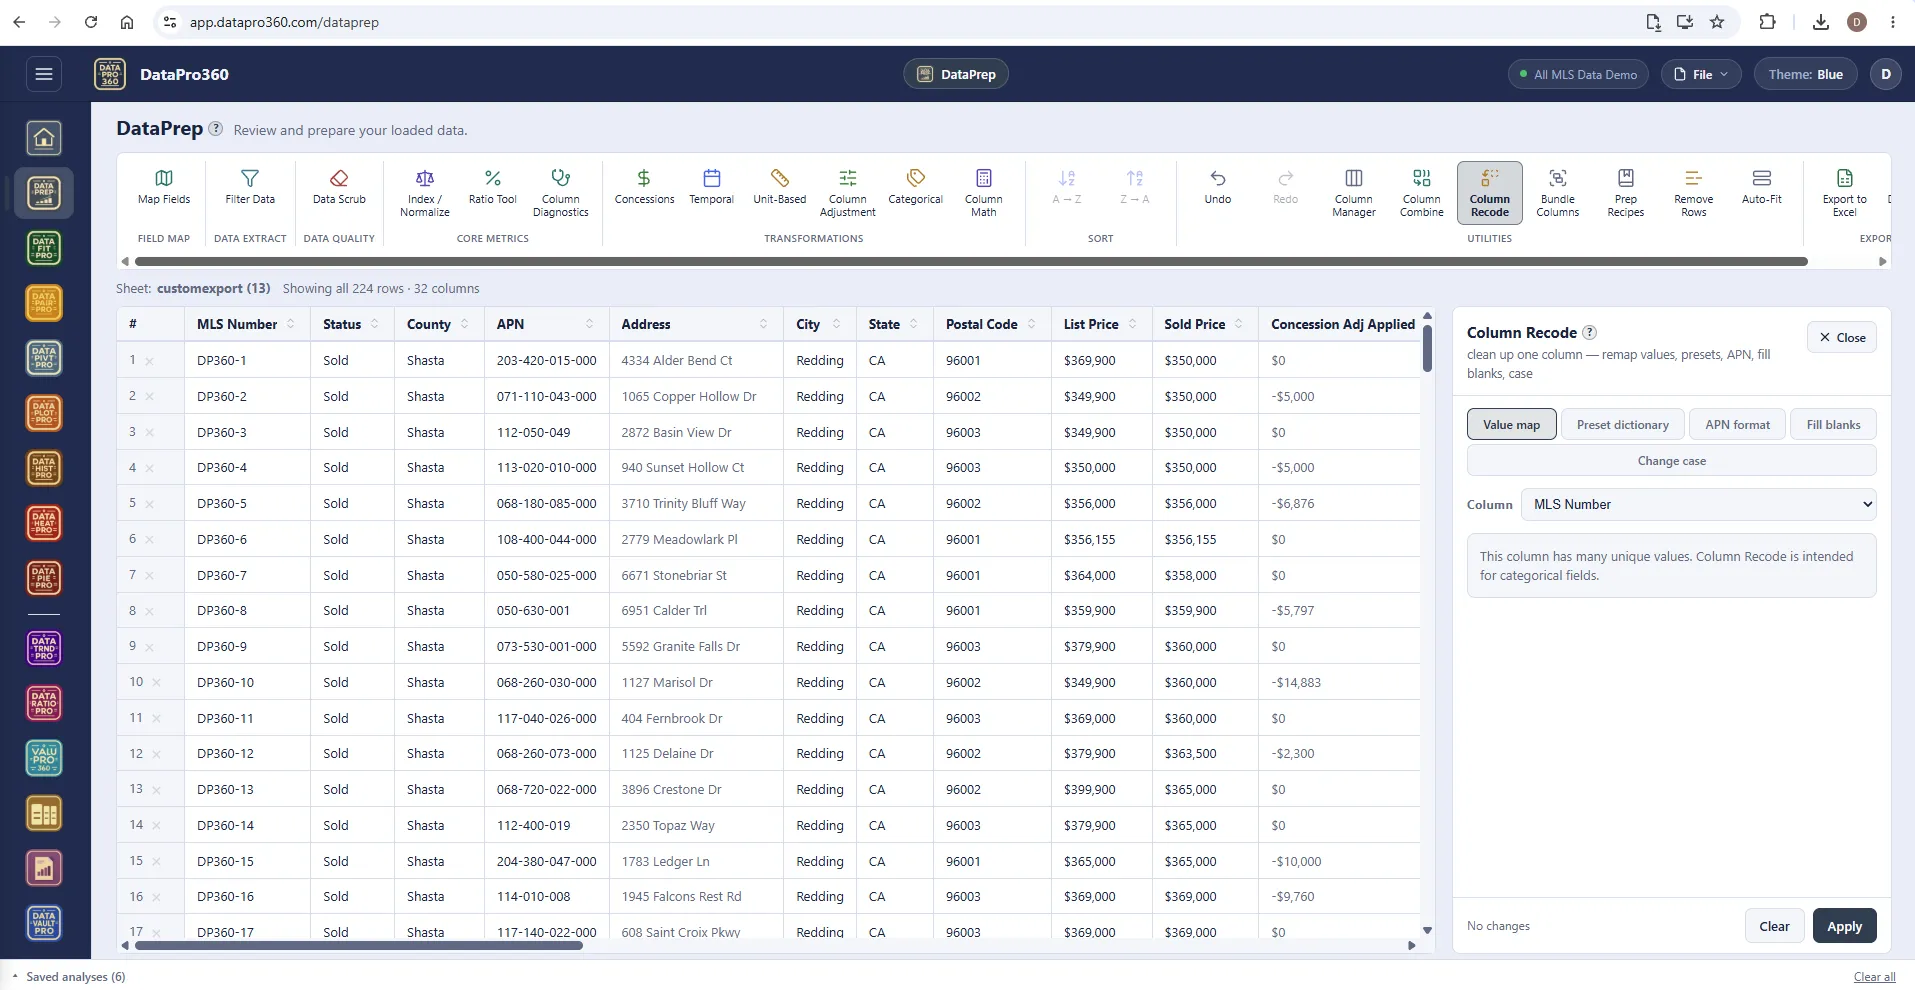
Column Recode — make inconsistent values consistent.
Remap values, apply a preset dictionary, normalize APN formats, fill blanks, change case. Recode before mapping so every downstream grouping — a pivot, a paired comparison, an amenity level — reads one consistent set of values instead of three spellings of the same thing.
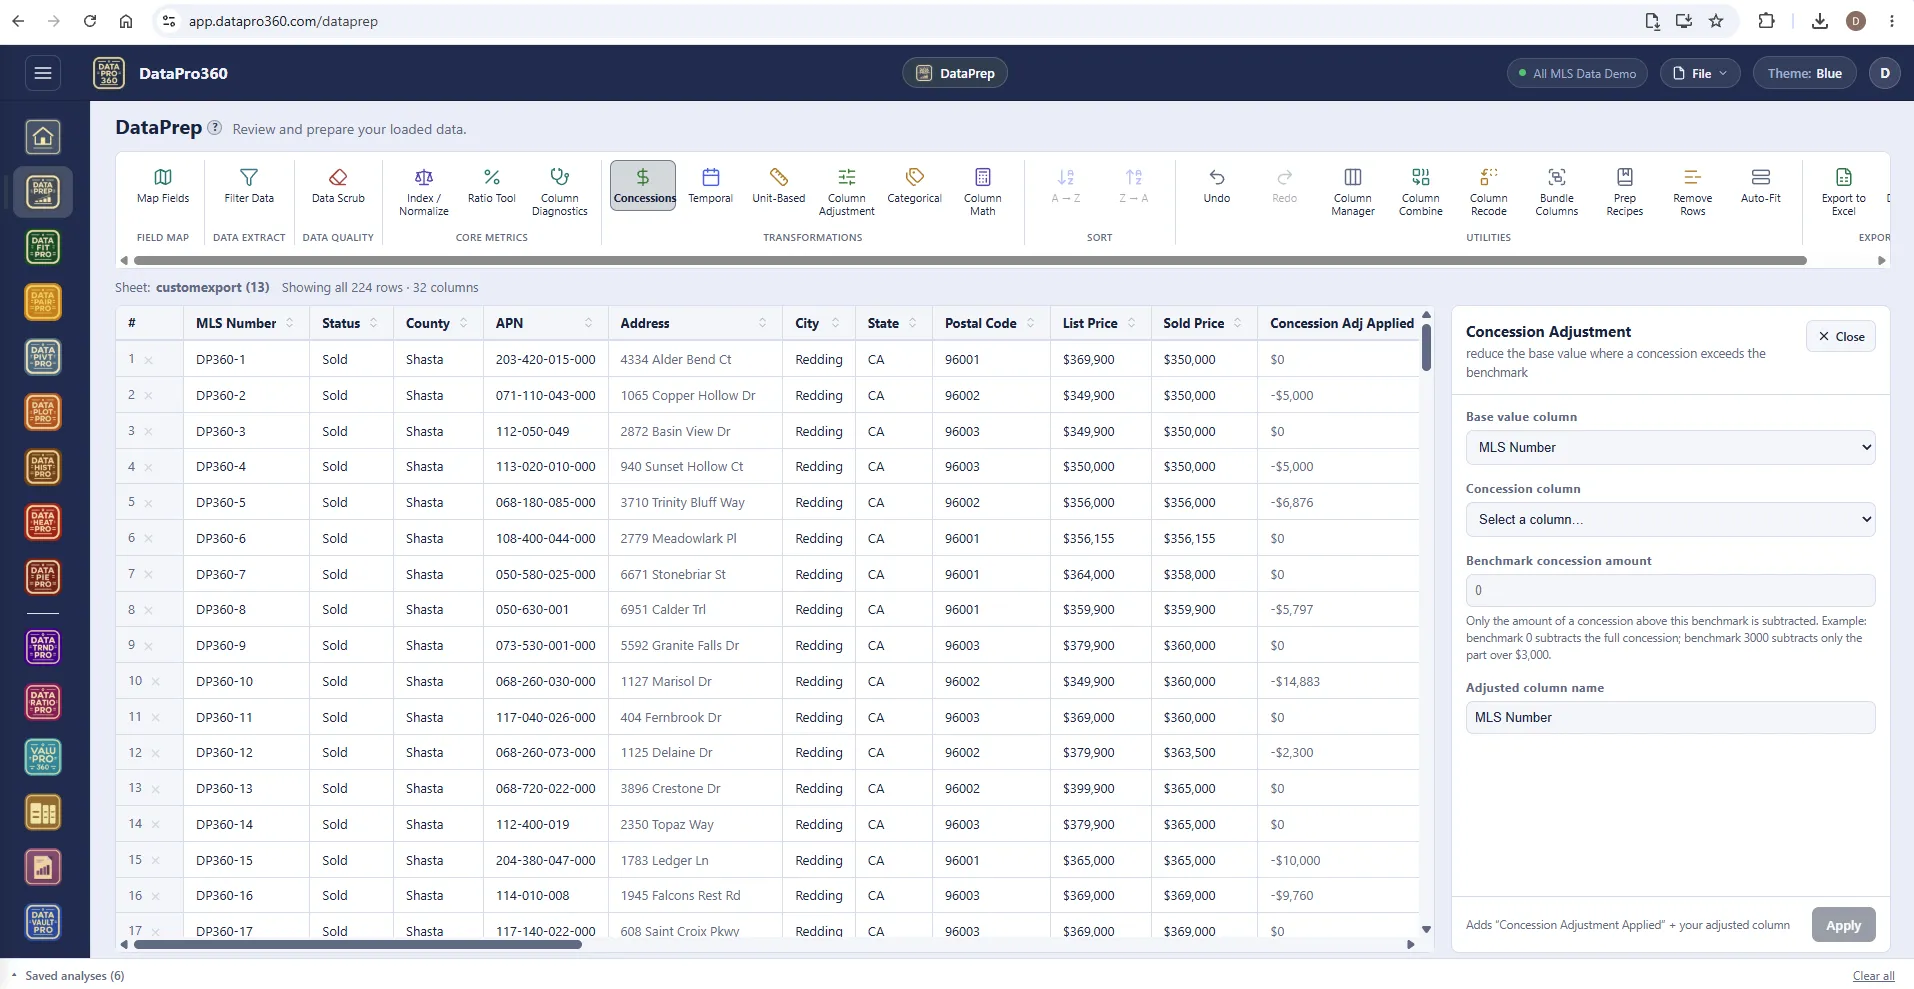
Concessions — reduce the base value above a benchmark.
Only the amount of a concession above the benchmark is subtracted: a benchmark of zero removes the full concession, a benchmark of $3,000 removes only the part over $3,000. Two paths share one engine — ValuPro360 enforces the layered order and shows the evidence; DataPrep's Transform menu gives full control when you know exactly what to apply.
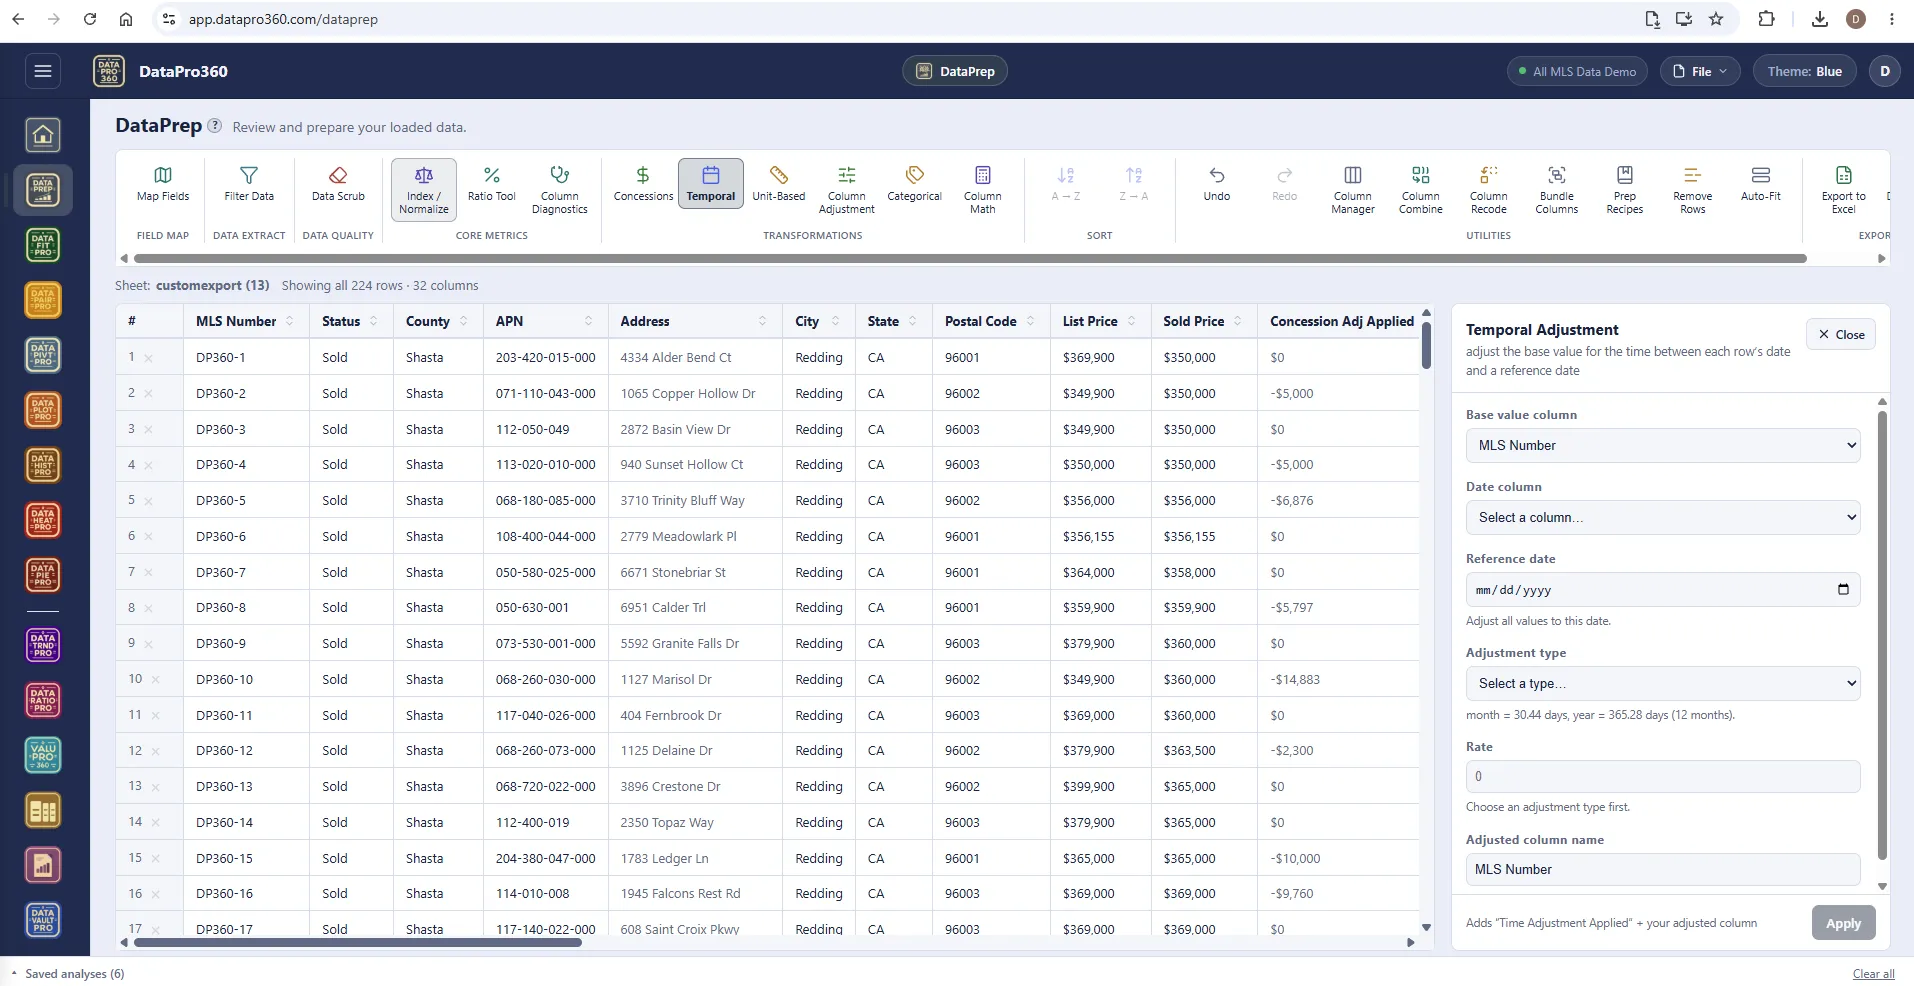
Temporal — adjust every row to one reference date.
Pick the base value column, the date column and the reference date, then a rate in dollars or percent per day, month or year. The program adds a Time Adjustment Applied column and your adjusted column, and every tool sees them immediately.
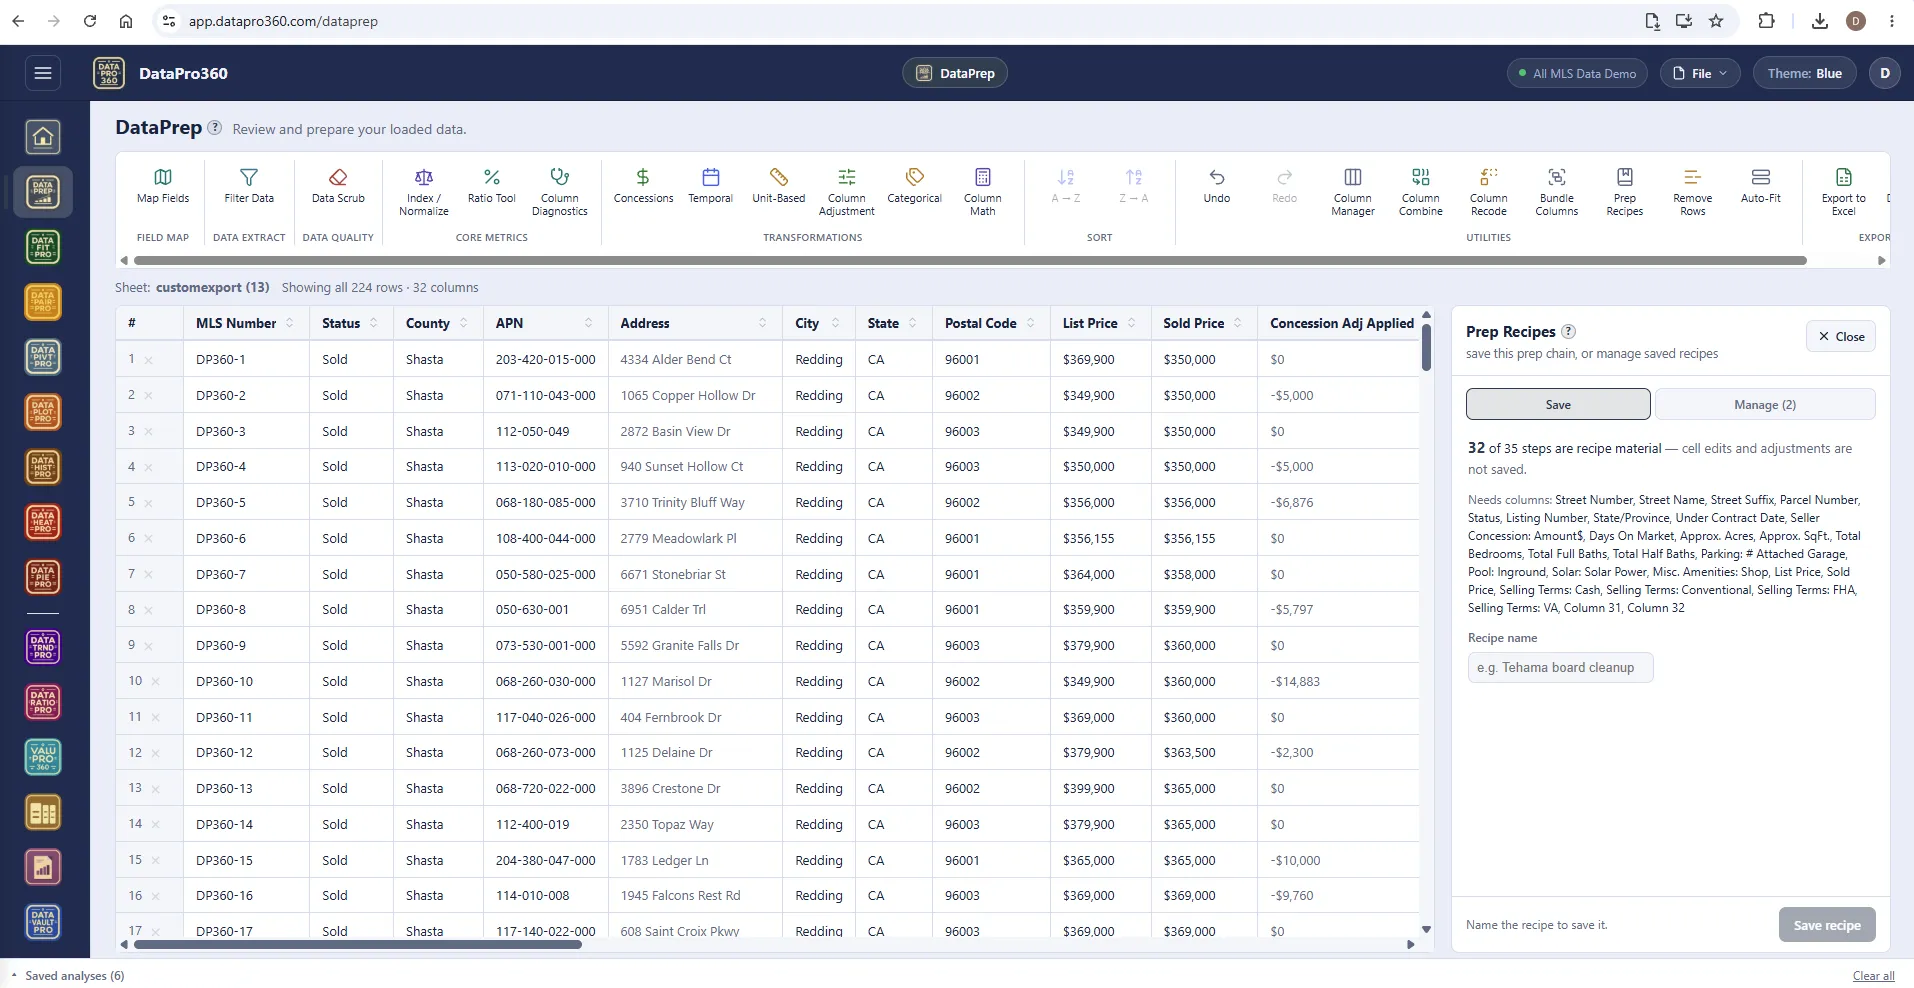
Prep Recipes — do it once, replay it every month.
Every export from the same source has the same problems. A recipe records the preparation steps — the filters, scrubs, recodes, combines and mapping — and replays them in order on the next file. Cell edits and applied adjustments are not recipe material; those belong to the assignment.
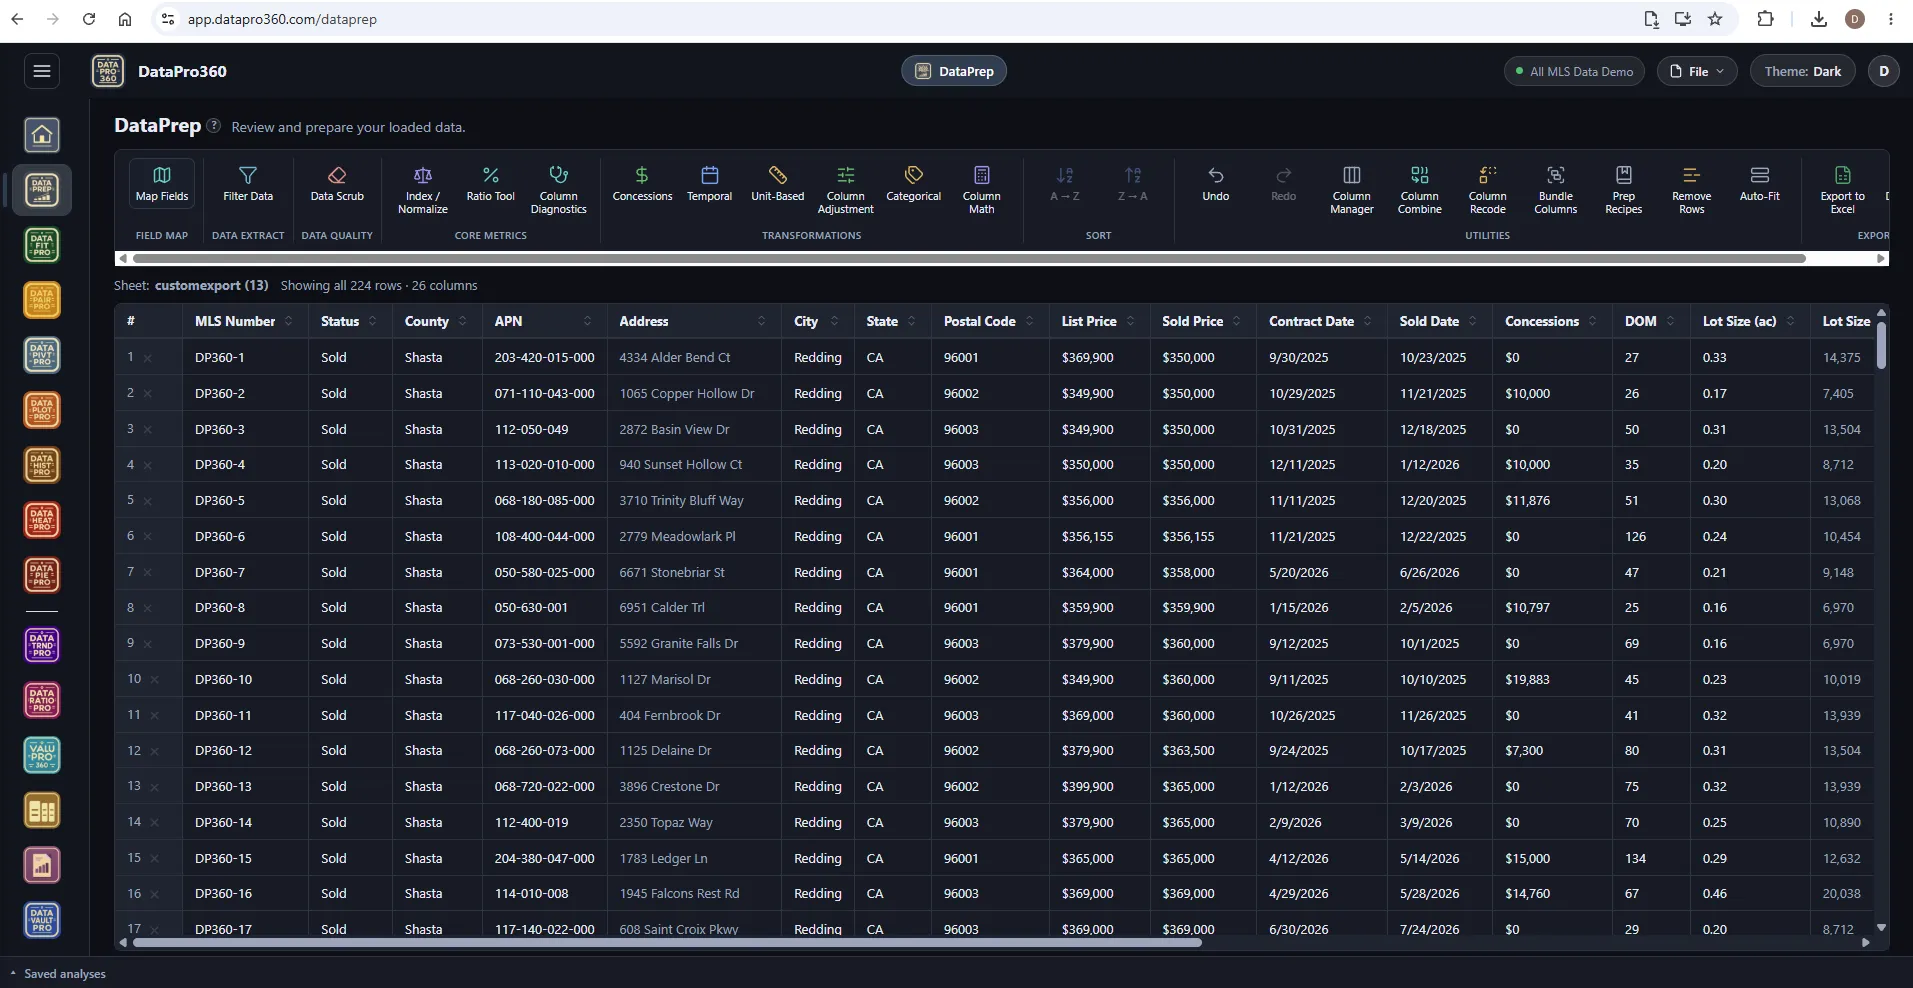
The same grid in the Dark theme.
Every DataPrep tool reads the same in Blue, Light or Dark. Switch from the top bar; the grid, the panels and the exports follow.
Where it sits
In the workflow
DataPrep is the second step: the export loads, DataPrep prepares it, and every surface after it — the stations, the tools, the grid — reads the prepared version. Sales pulled from DataVaultPro arrive here the same way.
See the whole workflow →Before
 DataVaultPro
 ValuPro360
 DataTrndPro
 Comp Grid
Prove the numbers in your next report.
Load your own MLS export and work a real assignment through the trial — every chart, every method, the finished report.
$69.95 per user, per month. 30-day free trial, no credit card required. No long-term contract.