
Comp Grid
Subject and comparables side by side, every adjustment on its own row — recomputing as you work.
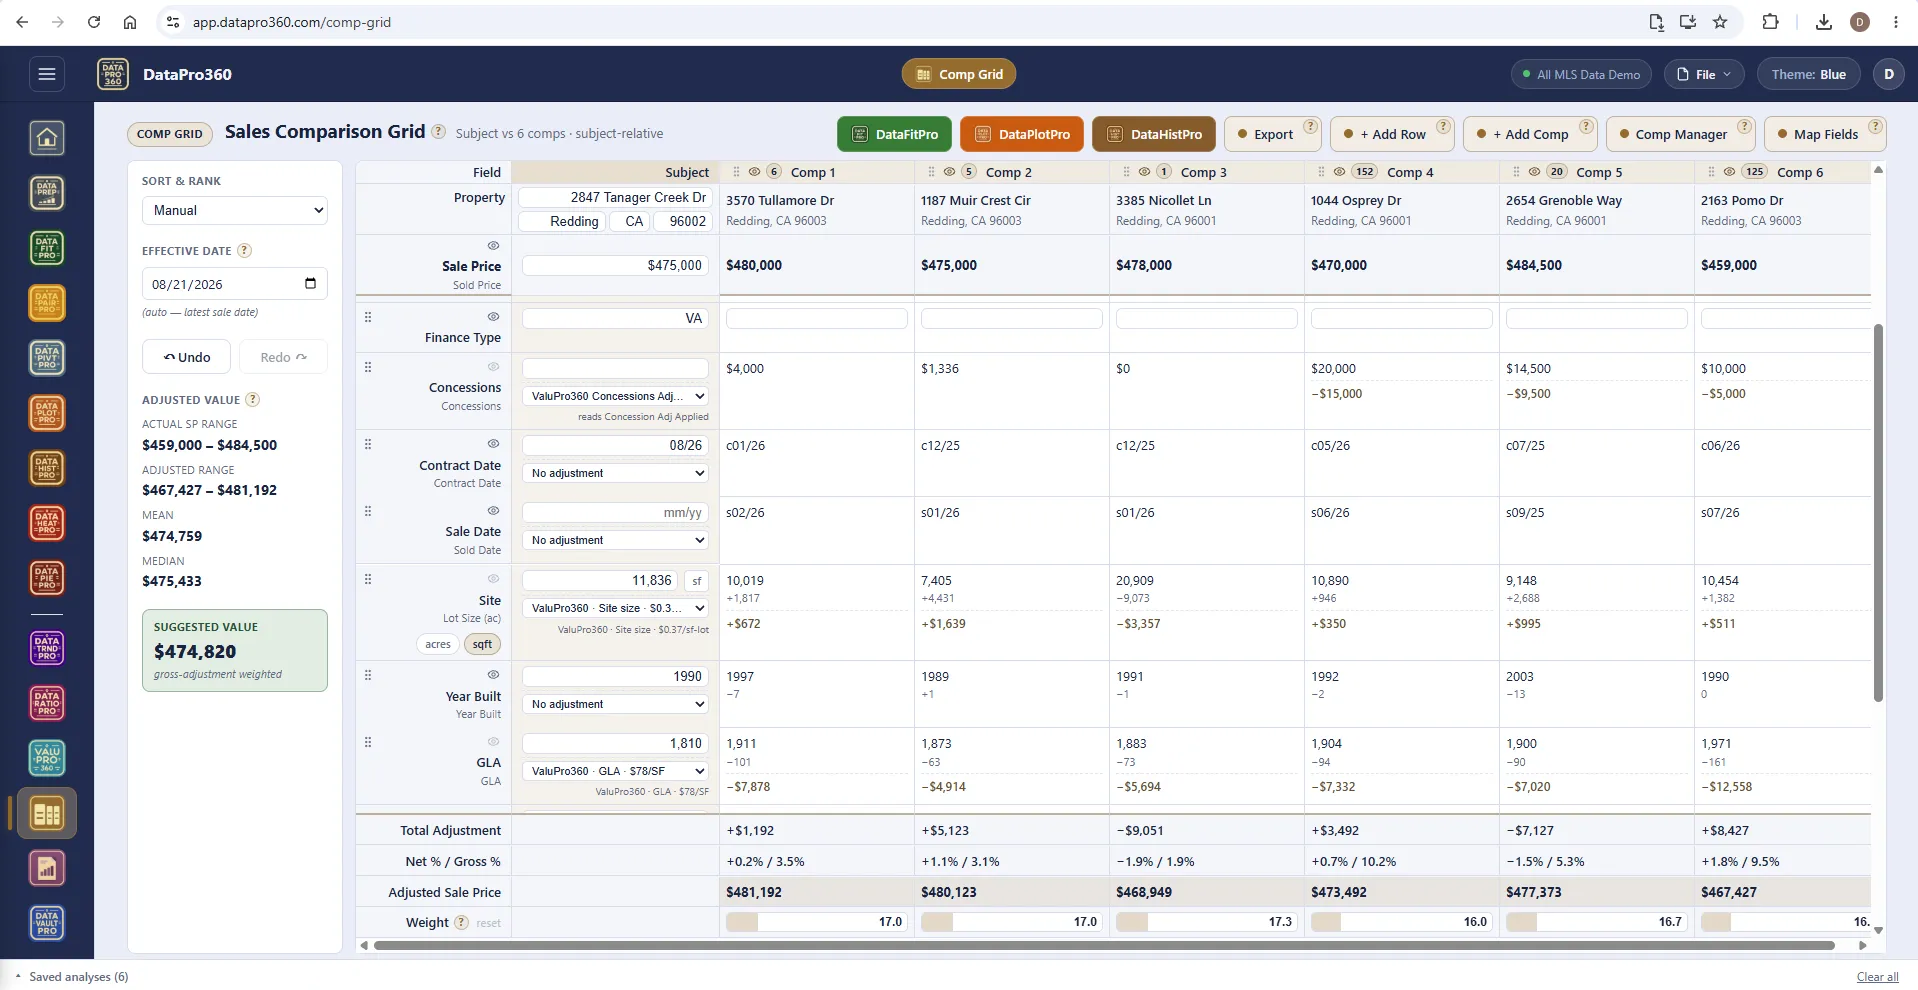
The final reconciliation grid — subject + comps with manual adjustments.
What it does
The Comp Grid is the reconciliation surface: the subject and the comparable sales side by side, every adjustment on its own row, and the adjusted prices at the foot of each column. Comparable sales come in from the dataset or are typed in by hand, and the appraiser's work is editable on every one of them. Identity rows document each sale — status, MLS number and days on market, verification, sale and financing type — and rows print only when something carries them.
The adjustments the walk decided are already there. A station states a value for a level — a shop is worth $10,543; the grid holds the subject's facts and does the differencing — this comparable has a shop, the subject does not, subtract. A station's value can be positive while the grid's adjustment is negative, and the reverse: the station measures the feature, the grid measures the difference between two properties. The time adjustment arrives through the handoff from the time work, derived once and applied consistently; rows without a published value take a rate you enter or a custom row you add.
Net and gross adjustment answer different questions. Net sums the adjustments with their signs, so positives and negatives cancel; gross sums their absolute values. A comparable adjusted up $40,000 and down $38,000 has a net of $2,000 and a gross of $78,000 — net says it barely moved, gross says it took a great deal of work to get there. Gross is the one that measures comparability, and the suggested value is gross-adjustment weighted by default; set the weights by hand and the report says appraiser-weighted.
Three of the standalone tools open directly on the grid's comparables — a scatter fit, a box plot and a histogram — reading the selected comps rather than the whole dataset, so you can see where your subject falls within your own comparables and whether your selection is tight or scattered. Export the grid to Excel, Word or PDF; what it concludes flows to Report Manager as the reconciliation exhibit. The grid holds the arithmetic and the documentation; the value conclusion and its reasons are the appraiser's, stated in the report.
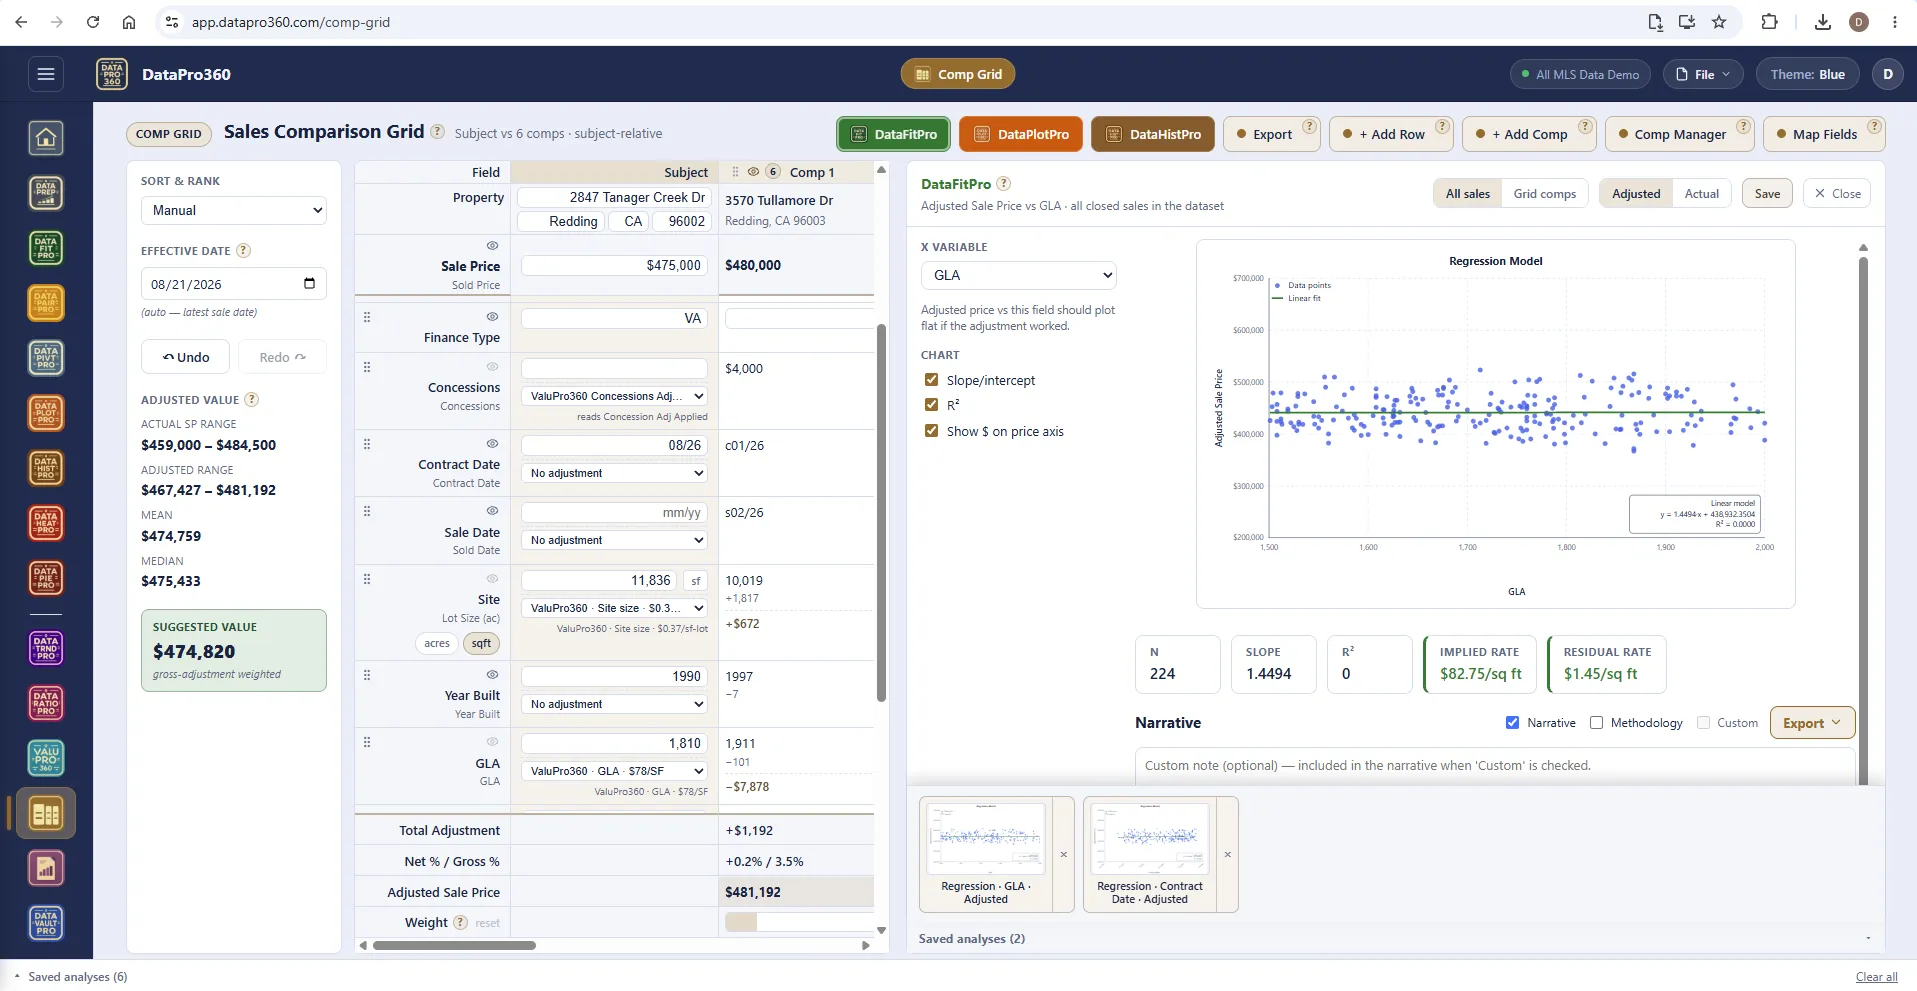
In-grid DataFitPro — did the adjustment work?
Adjusted sale price against GLA over all closed sales should plot flat if the GLA adjustment removed what it was meant to remove. The panel states the implied rate and the residual rate side by side — here $82.75 per square foot implied, $1.45 left over — and saves as a diagnostic exhibit for the report.
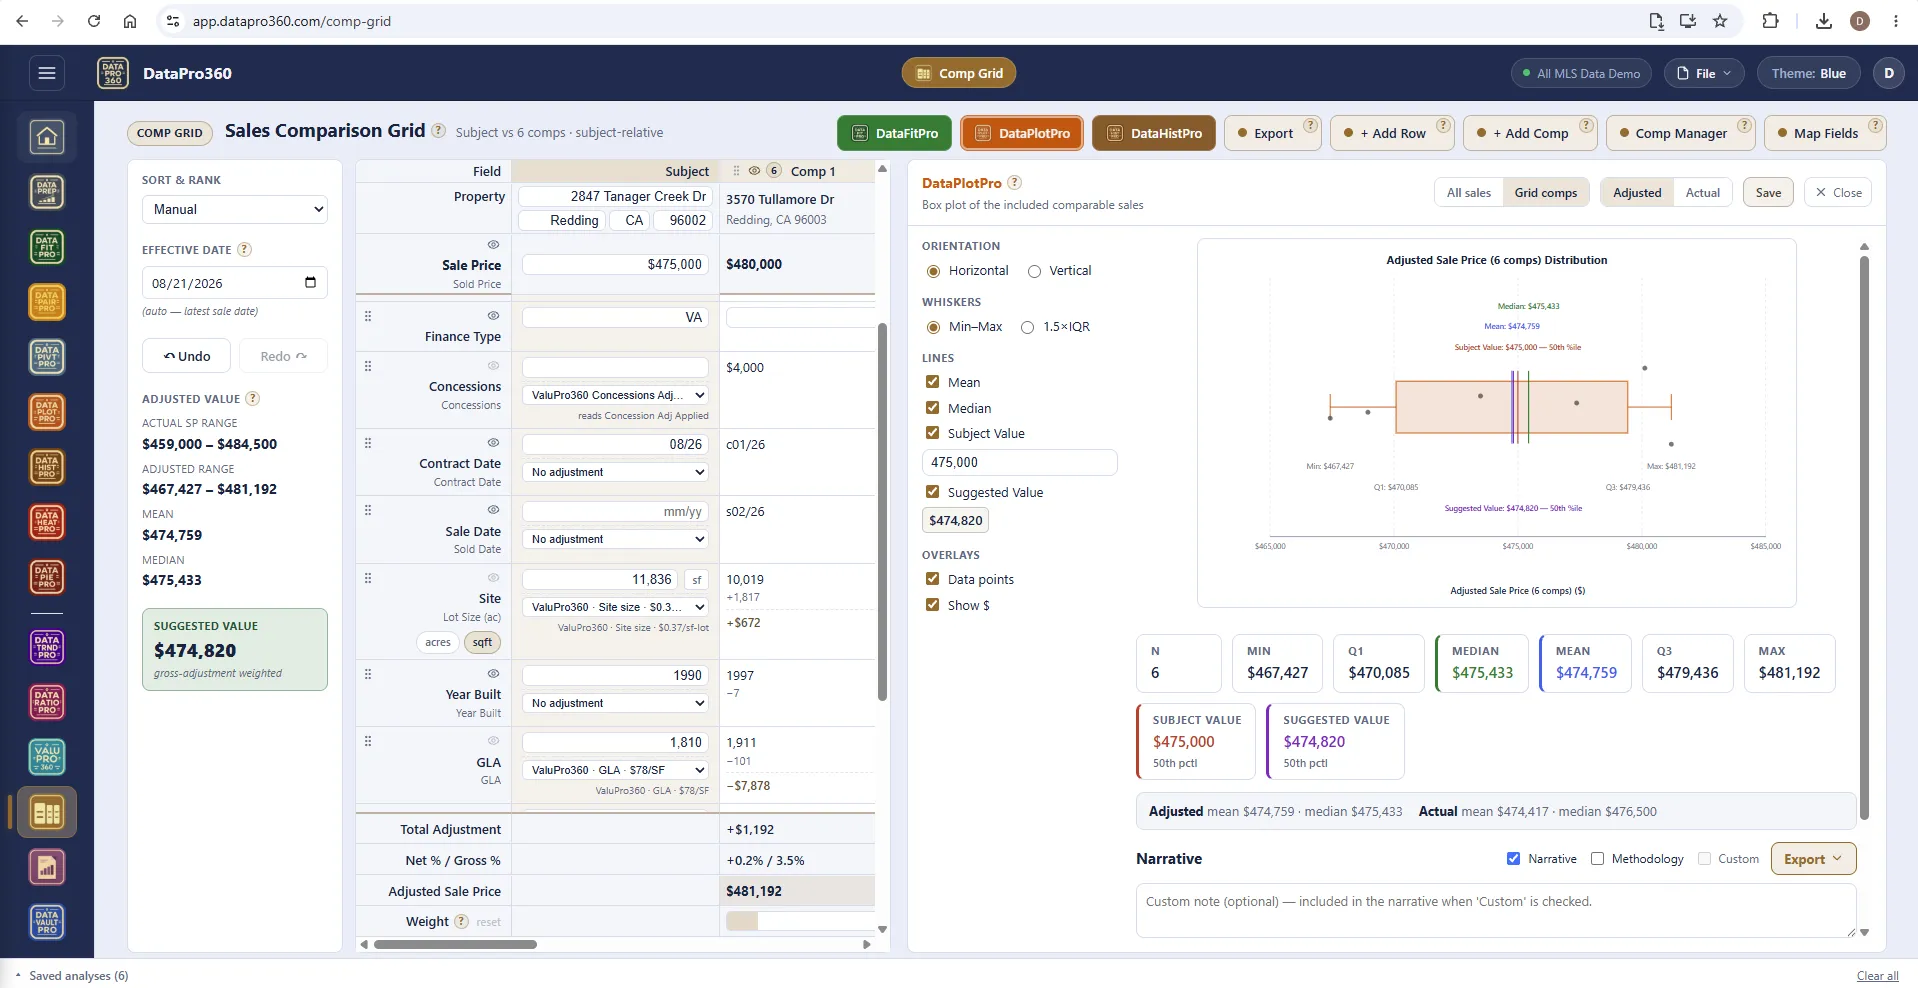
In-grid DataPlotPro — the subject among the comps.
A box plot of the six included comparables' adjusted prices, with the subject value and the suggested value placed at their percentiles — both at the 50th here — and the adjusted and actual means and medians stated beneath.
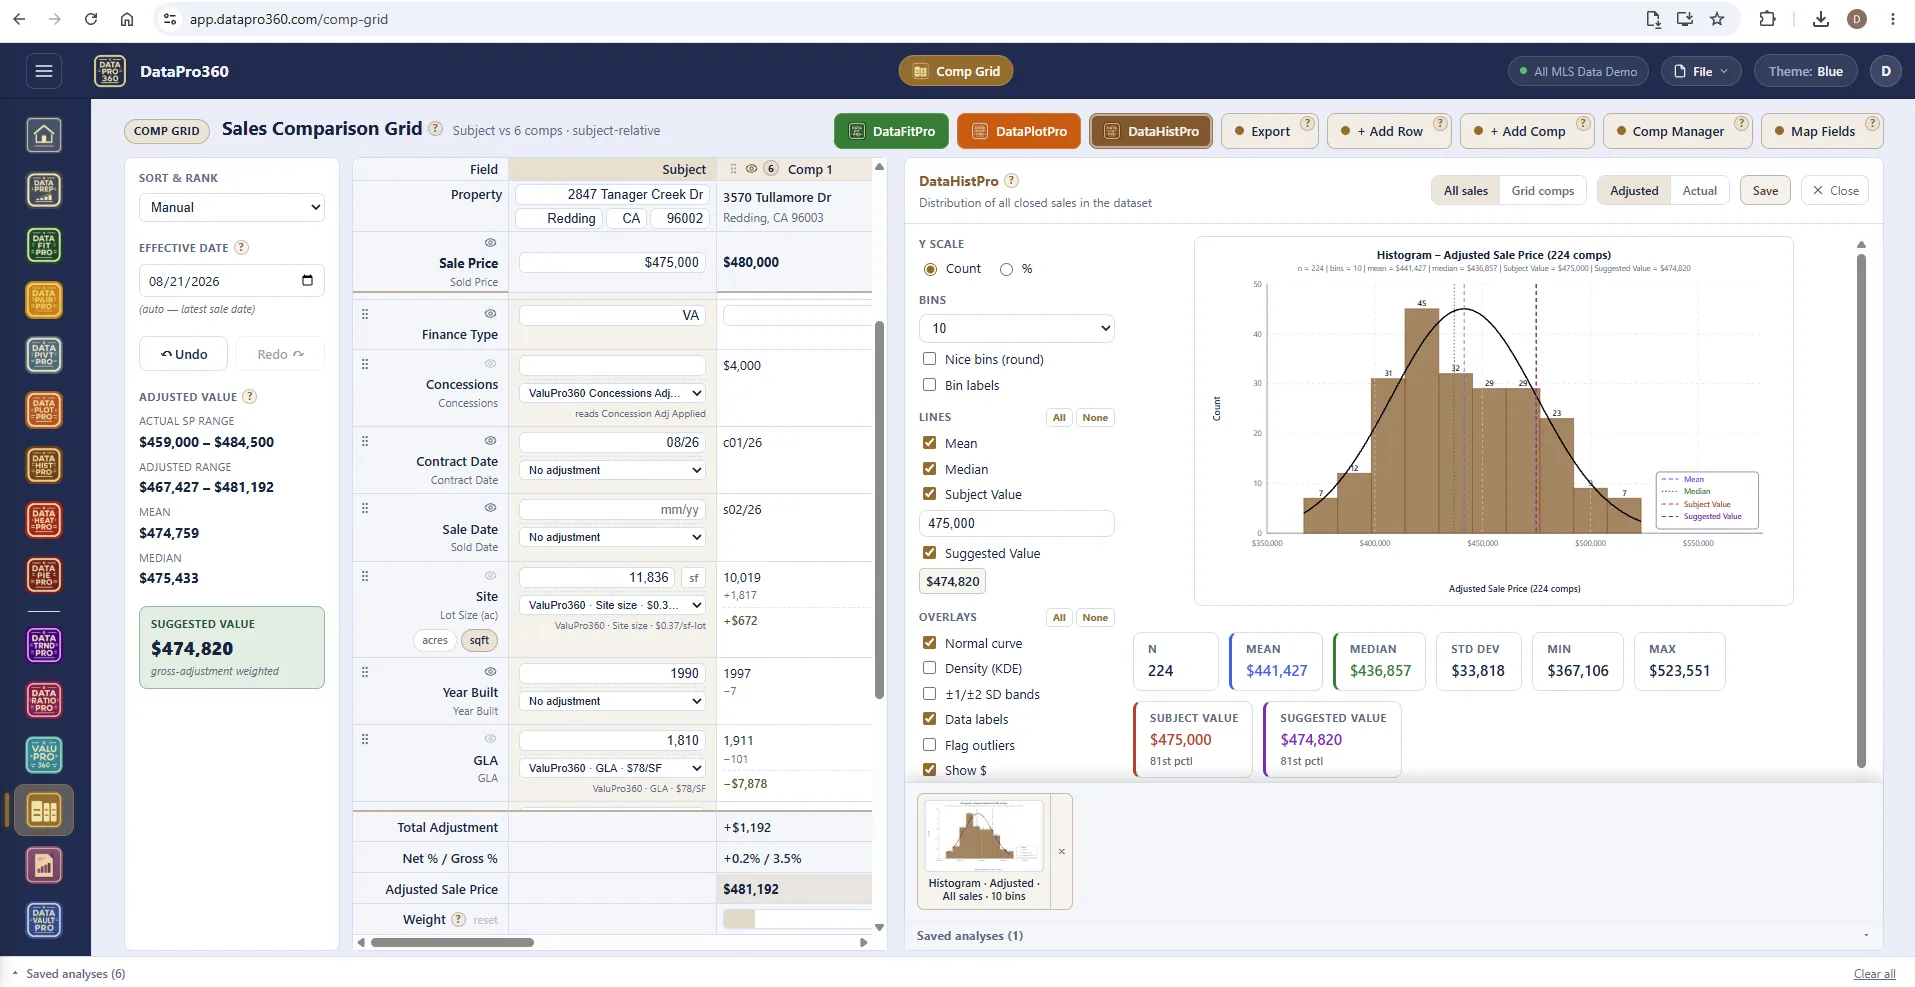
In-grid DataHistPro — the subject among all sales.
The same histogram over every closed sale in the dataset, adjusted, with the subject and suggested values placed — 81st percentile here — and the switch between all sales and grid comps, adjusted and actual, one click away.
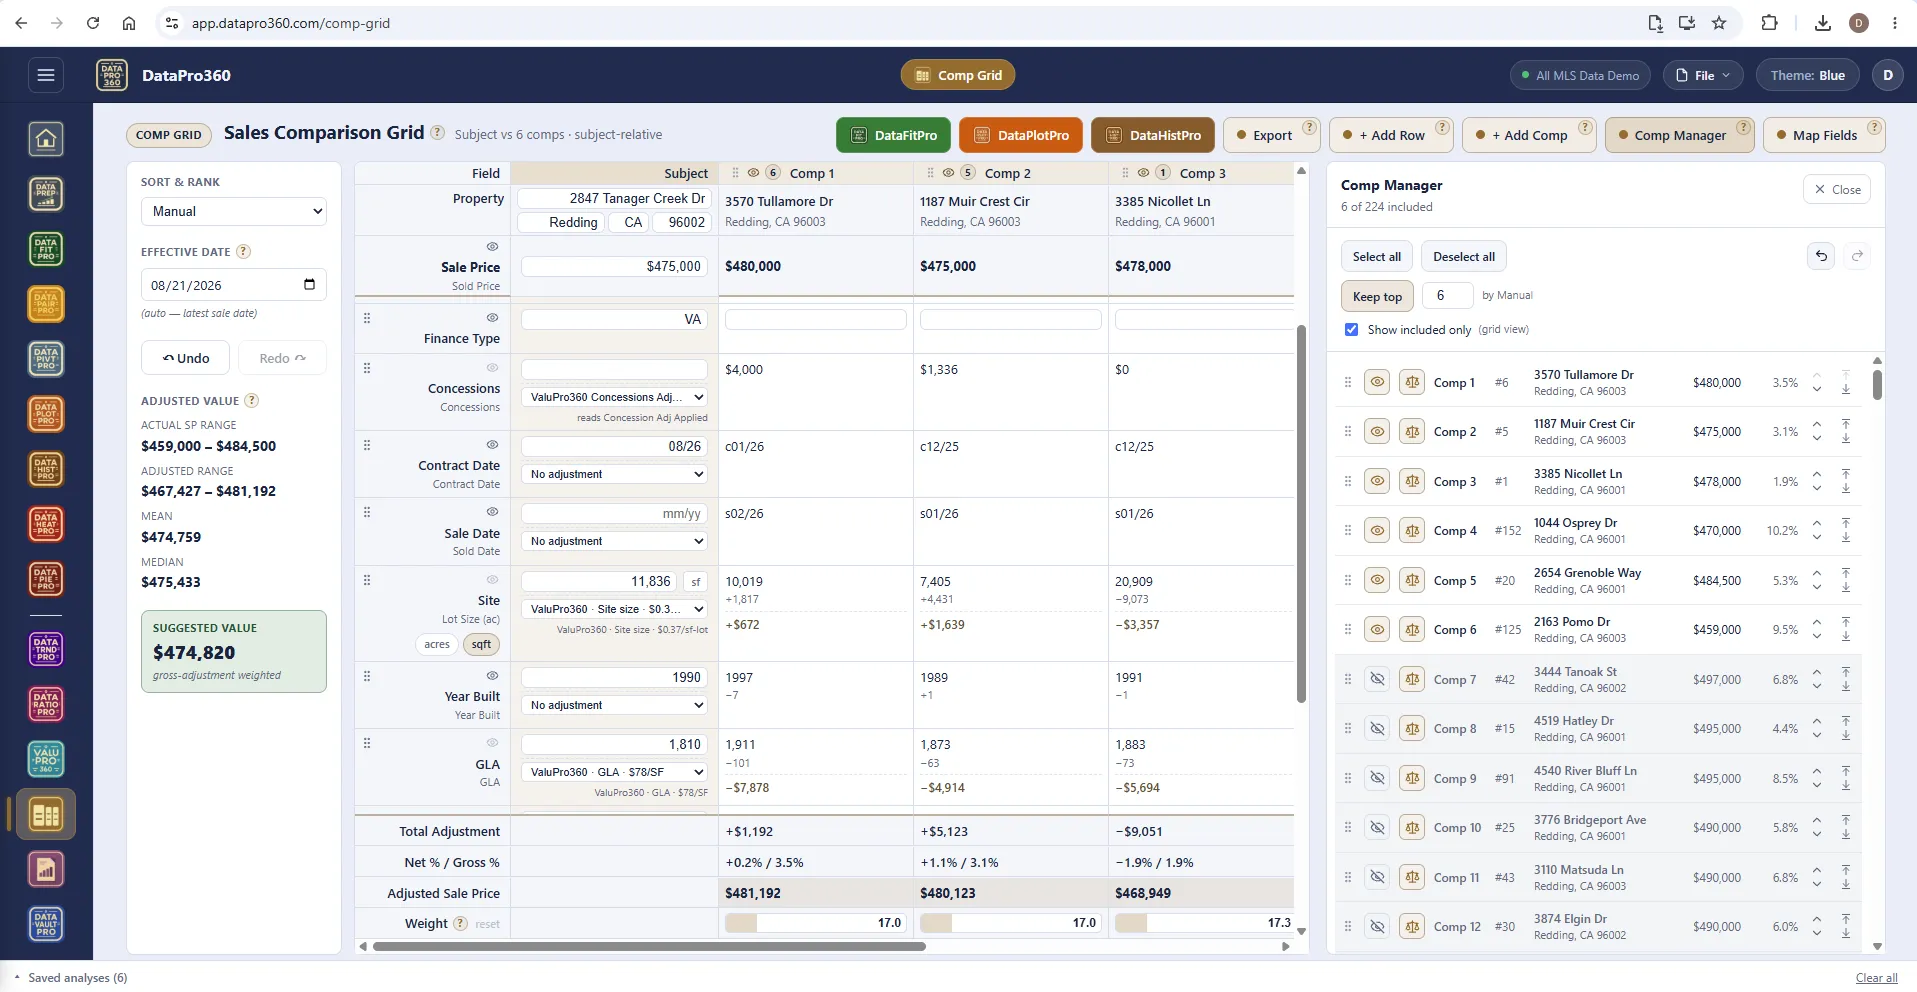
The Comp Manager — which sales, in what order.
Six of 224 included. Keep the top N by manual rank or by gross adjustment, toggle a comparable in or out, drag to reorder, and see each sale's gross-adjustment percentage beside it. A hand-added comparable behaves like any other in the grid — it carries adjustments, contributes to the ranges and takes a weight.
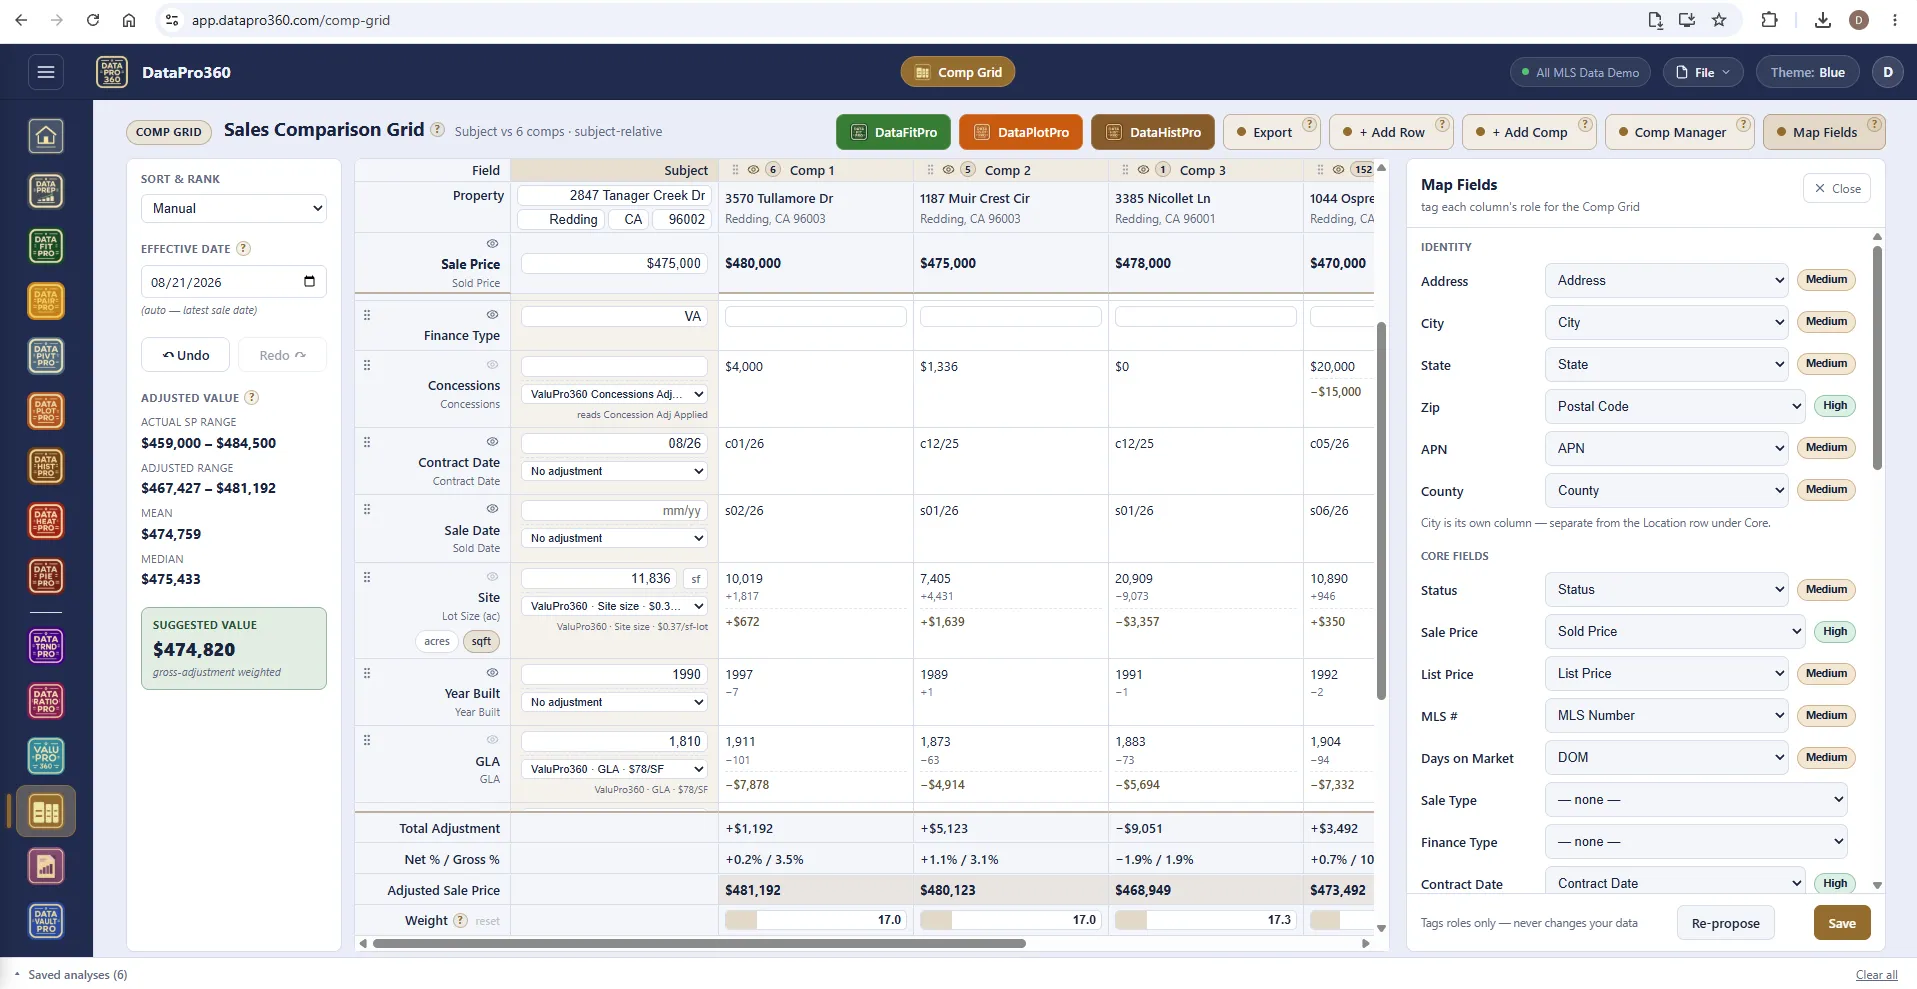
Map Fields — the grid builds its rows from mapped roles.
Tag each column's role for the grid — identity fields, core fields, the dates, the physical characteristics — with a confidence badge on each proposal. An unmapped field has no row. Mapping tags roles only and never changes the data; re-propose when a new file arrives.
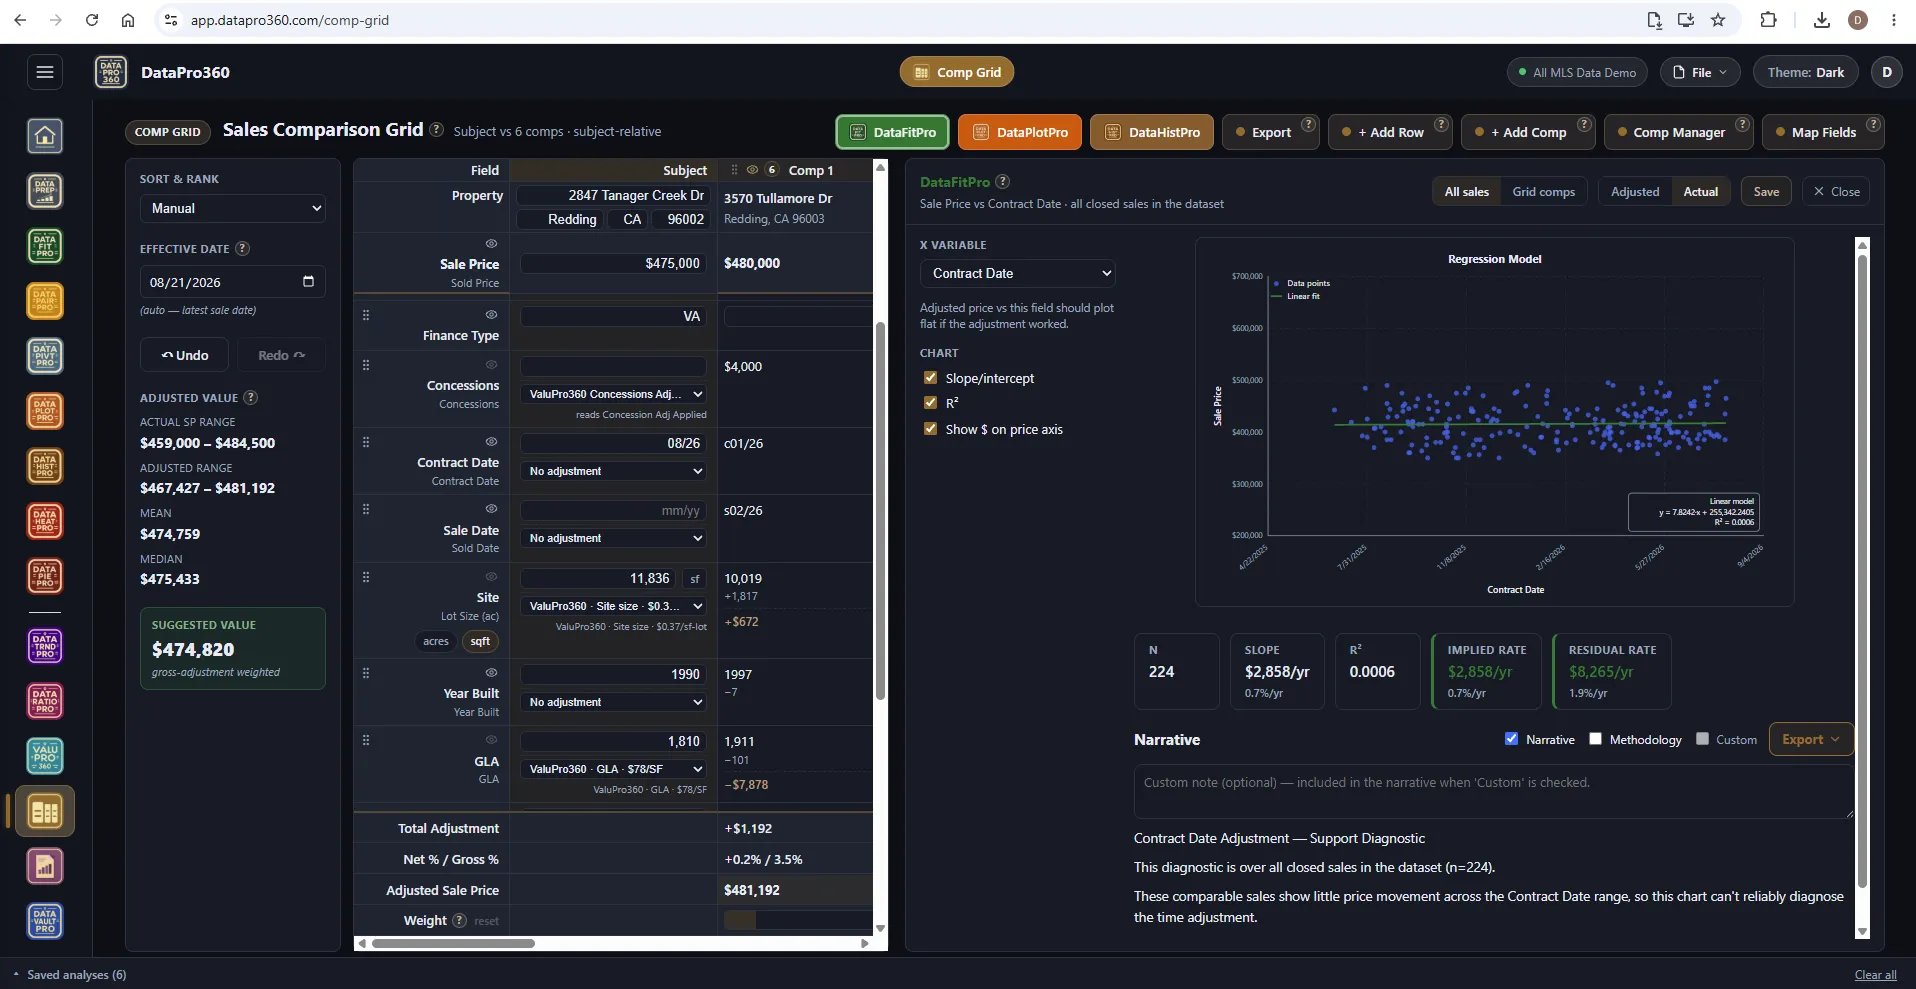
The support diagnostic, in the Dark theme.
Sale price against contract date over all closed sales: the in-grid fit as a support diagnostic for the time adjustment, stating in plain words when the sales show too little movement for the chart to diagnose it.
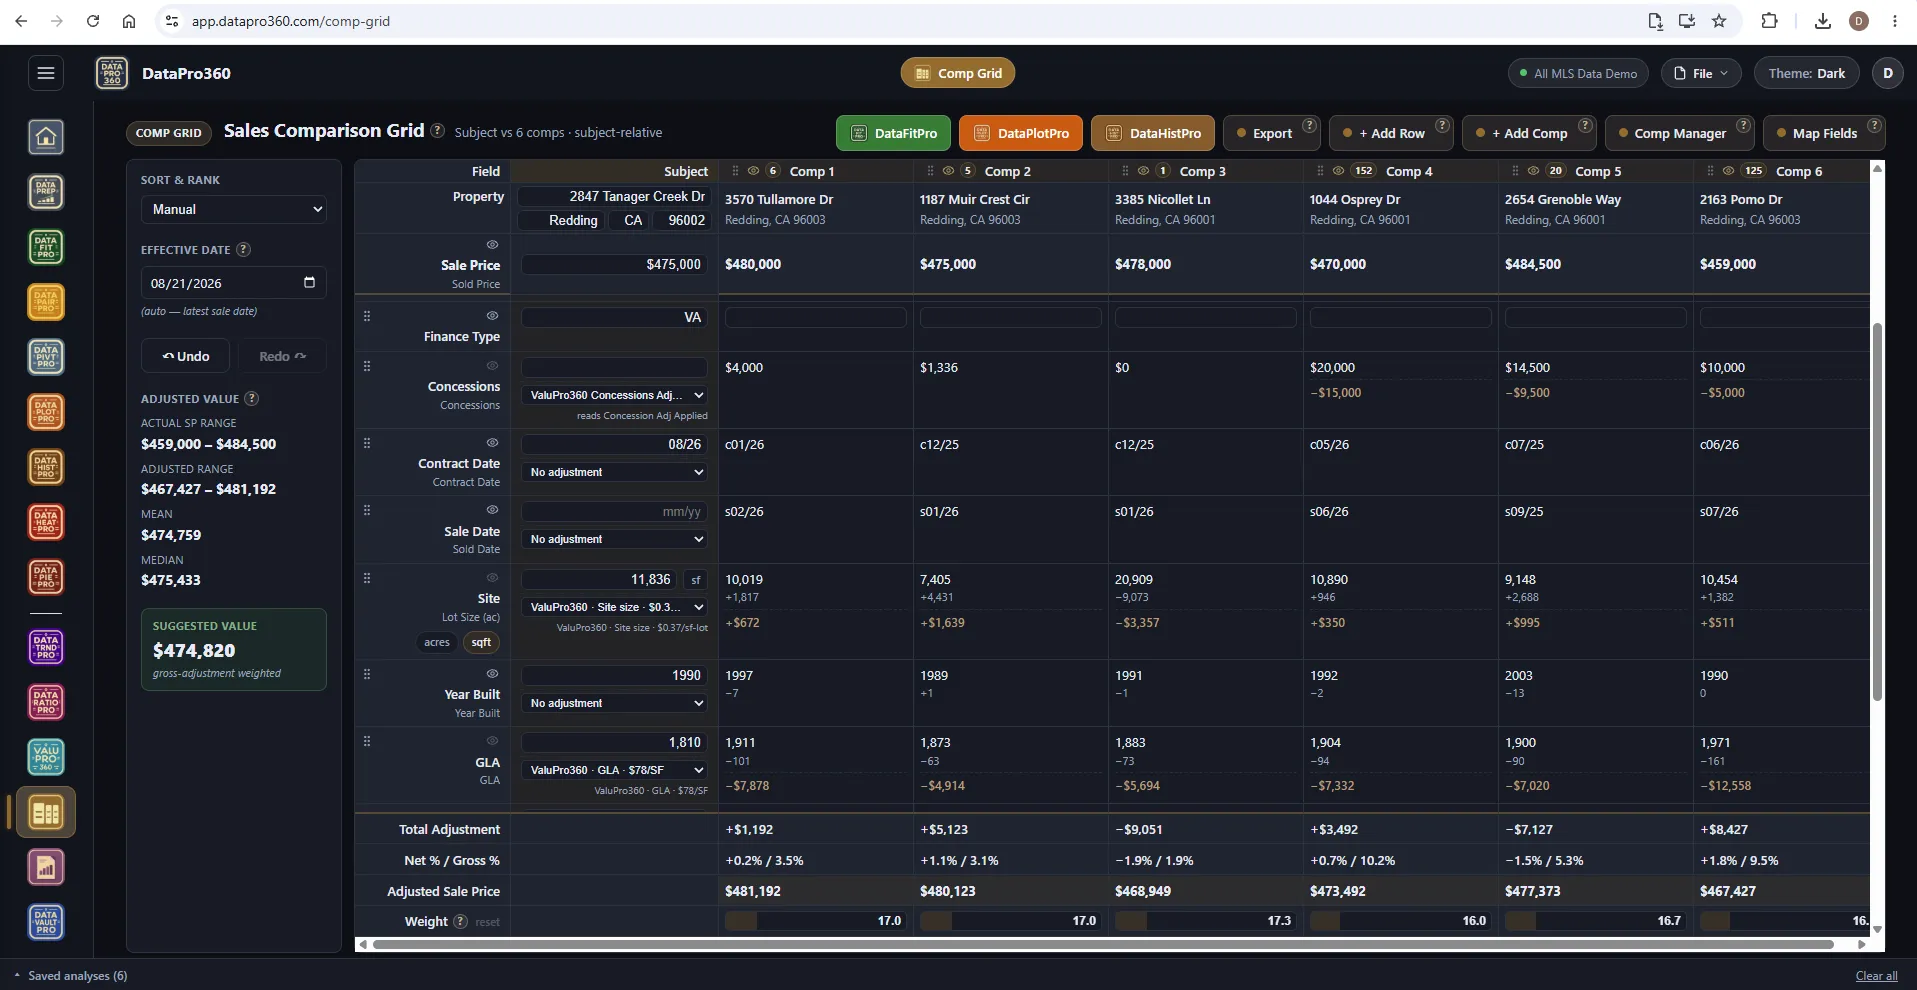
The grid in the Dark theme.
Subject and six comparables, the adjustment rows with their published sources, total adjustment, net and gross percentages, adjusted sale prices and the weights, on the dark workspace.
Where it sits
In the workflow
The grid reads what the stations published and what DataTrndPro decided, draws comparables from the dataset or the vault, and hands its conclusion to Report Manager as the reconciliation exhibit and the adjustment summary.
See the whole workflow → ValuPro360
 DataTrndPro
 DataVaultPro
After
 Report Manager
Prove the numbers in your next report.
Load your own MLS export and work a real assignment through the trial — every chart, every method, the finished report.
$69.95 per user, per month. 30-day free trial, no credit card required. No long-term contract.