
DataPlotPro
Box plots — a distribution in five numbers, with your reference value placed at its percentile.
Box plots — distribution summaries of any numeric field.
What it does
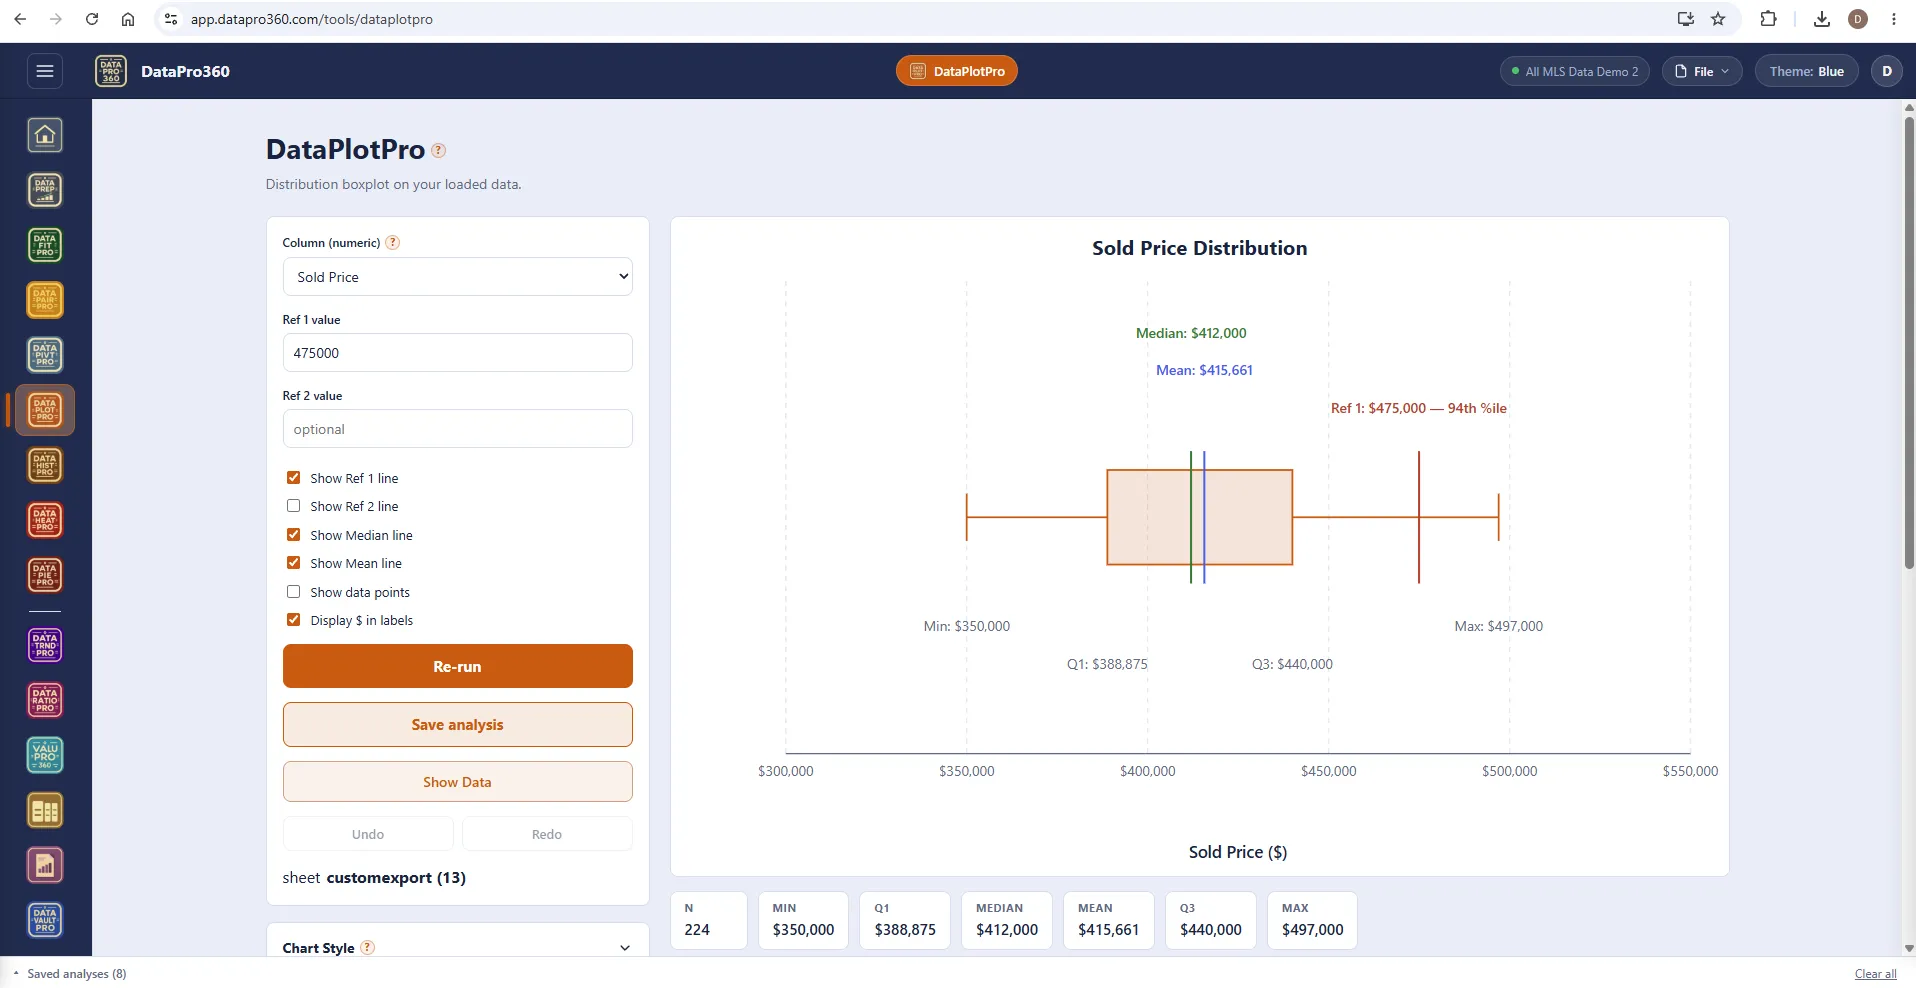
DataPlotPro draws box plots of any numeric field — a distribution summarized in five numbers and drawn so the shape reads at a glance: minimum, first quartile, median, third quartile, maximum, with the mean marked and the whiskers showing the reach of the data.
One run draws one box: choose the column, Run, and the box, whiskers and outliers summarize that column for the rows included. Enter a reference value — a subject's indicated value, a contract price — and the plot places it as a line with its percentile, so you can see at once where it sits among the sales. To compare distributions, run and save them one at a time and read the saved results against each other.
A box plot hides as much as it shows — the count behind it, and the shape within each quartile — so the statistics strip reports n, minimum, Q1, median, mean, Q3 and maximum, and Show Data holds every row. Show the individual points when the count matters.
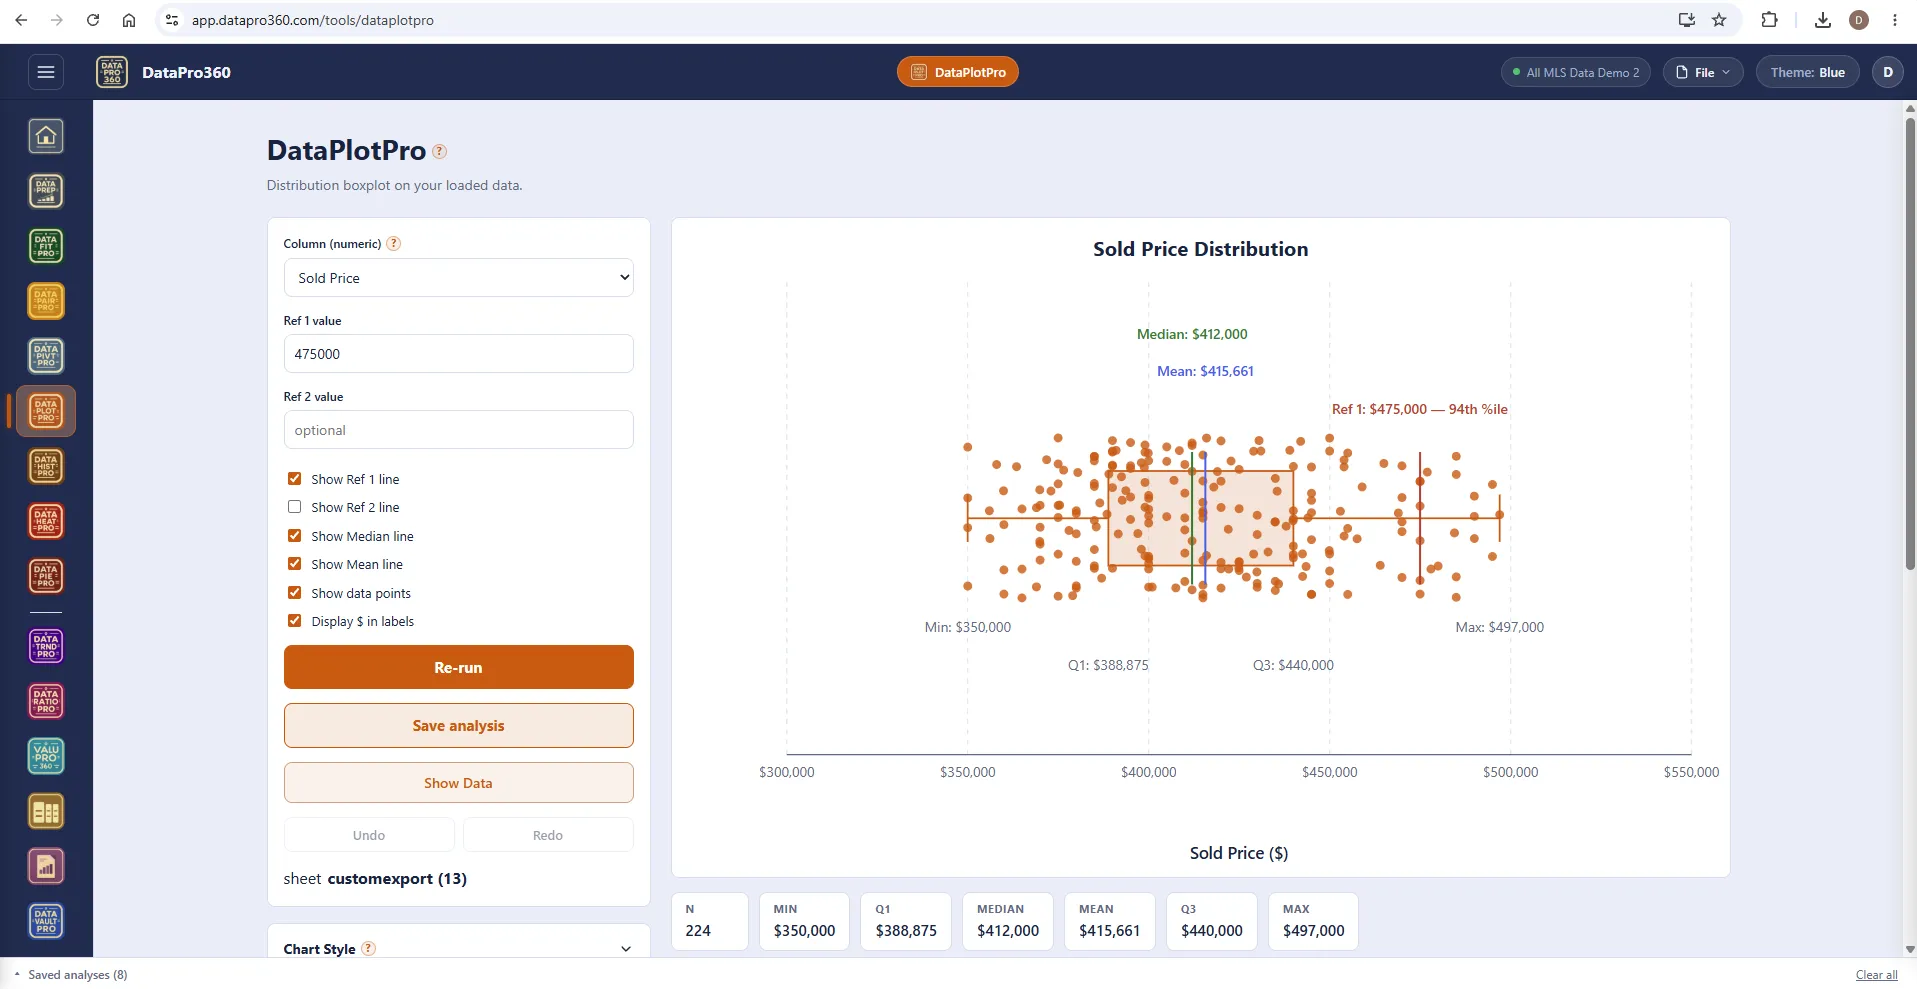
Show the points.
Toggle the data points on and every sale is drawn over the box, jittered so the density reads — where the sales cluster, where they thin out, and where the reference line falls among them.
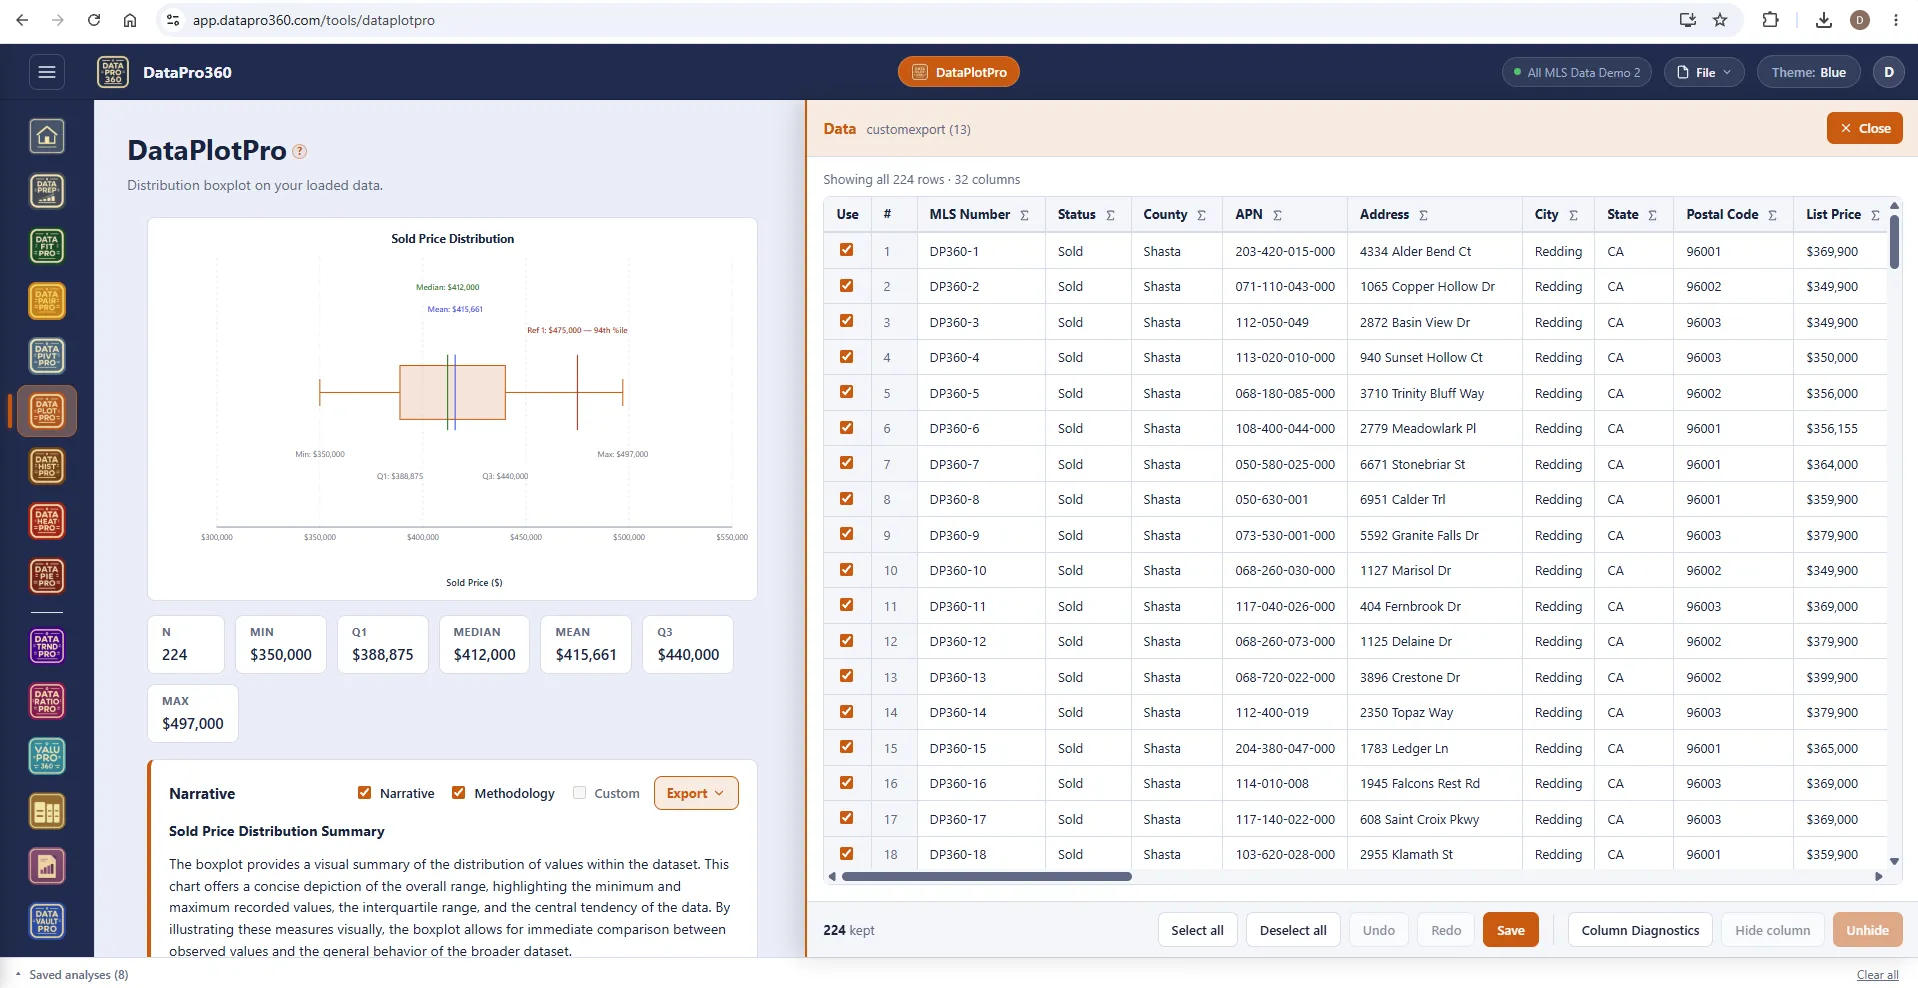
Show Data and the narrative.
The rows behind the box, each with a Use checkbox; the narrative beneath the chart describes the distribution and the methodology, and travels with the chart when you export.
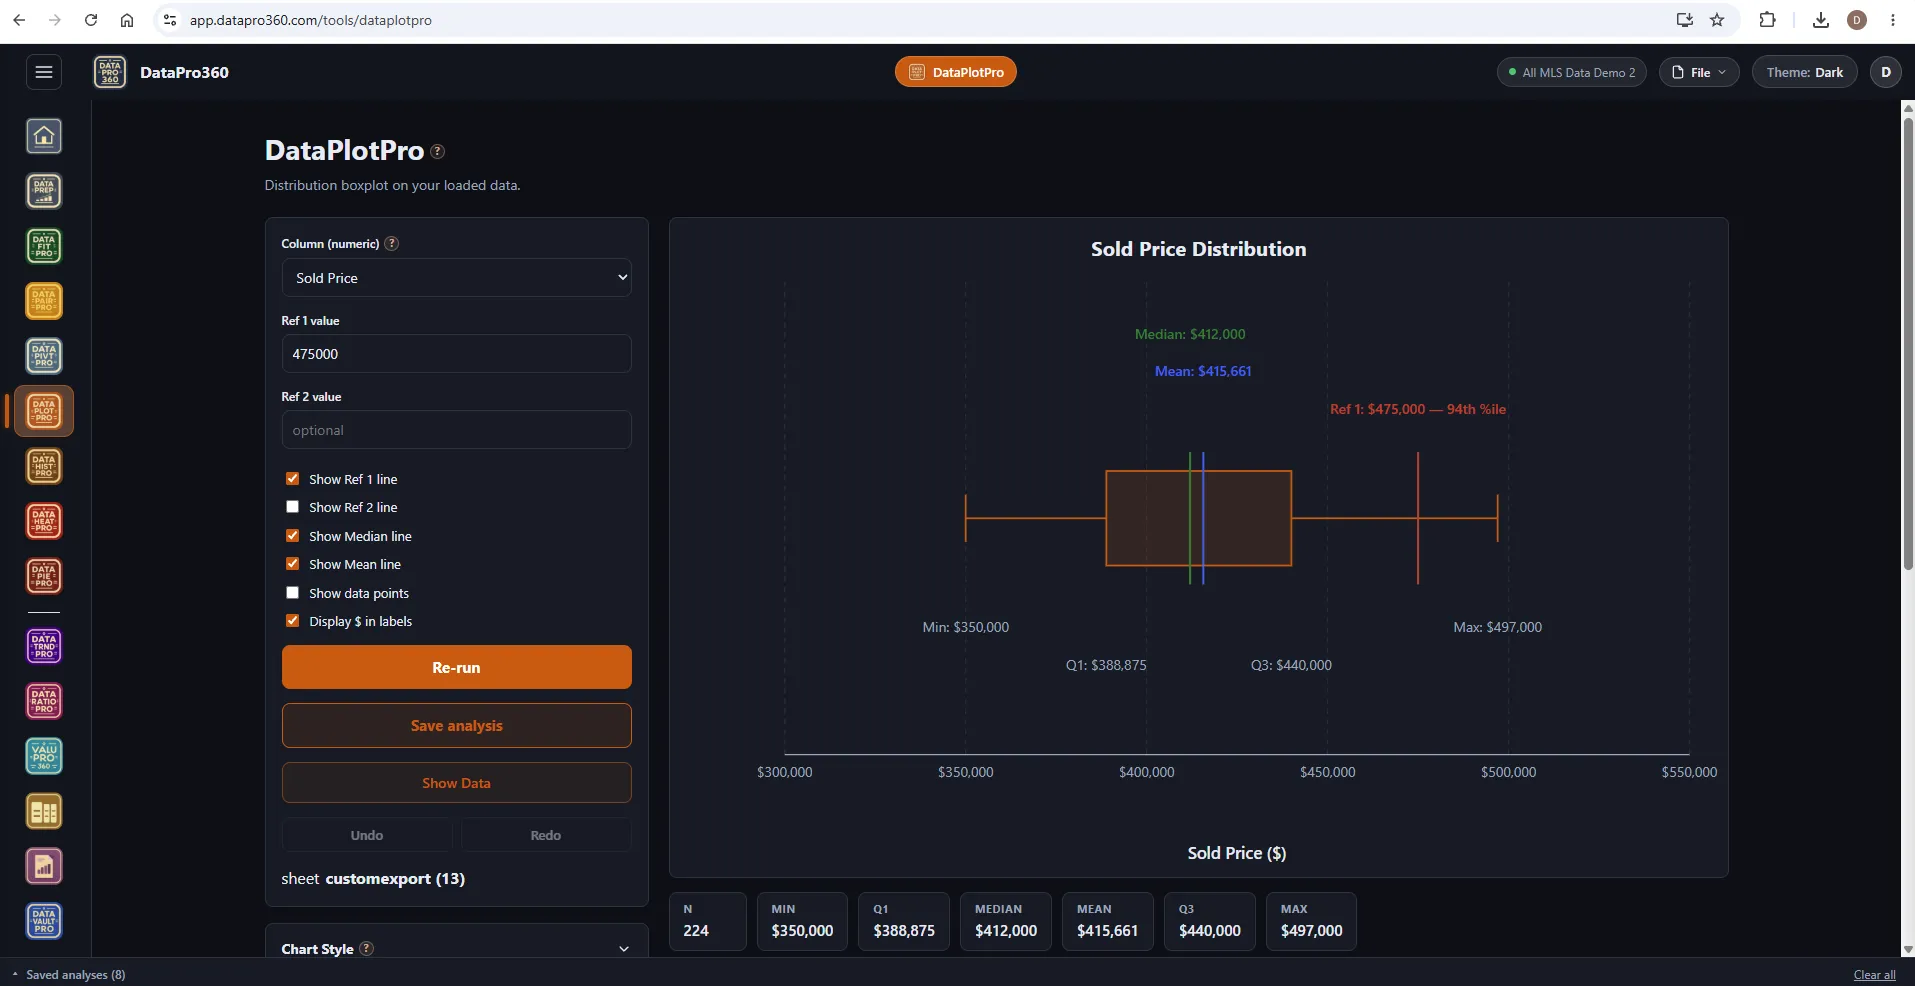
The same box in the Dark theme.
Box, whiskers, reference line and strip on the dark workspace.
Where it sits
In the workflow
DataPlotPro reads the prepared dataset and can be opened directly on the Comp Grid's comparables, where a box plot of the sales you are actually using places the subject among them. A saved plot carries into Report Manager.
See the whole workflow →Before
 DataPrep
After
 Comp Grid
 Report Manager
Prove the numbers in your next report.
Load your own MLS export and work a real assignment through the trial — every chart, every method, the finished report.
$69.95 per user, per month. 30-day free trial, no credit card required. No long-term contract.