The workflow
From MLS export to finished report.
Five steps. You do not have to work in this order and you do not have to use every surface — this is the path that uses the program as designed, and it is the path a reviewer can follow.
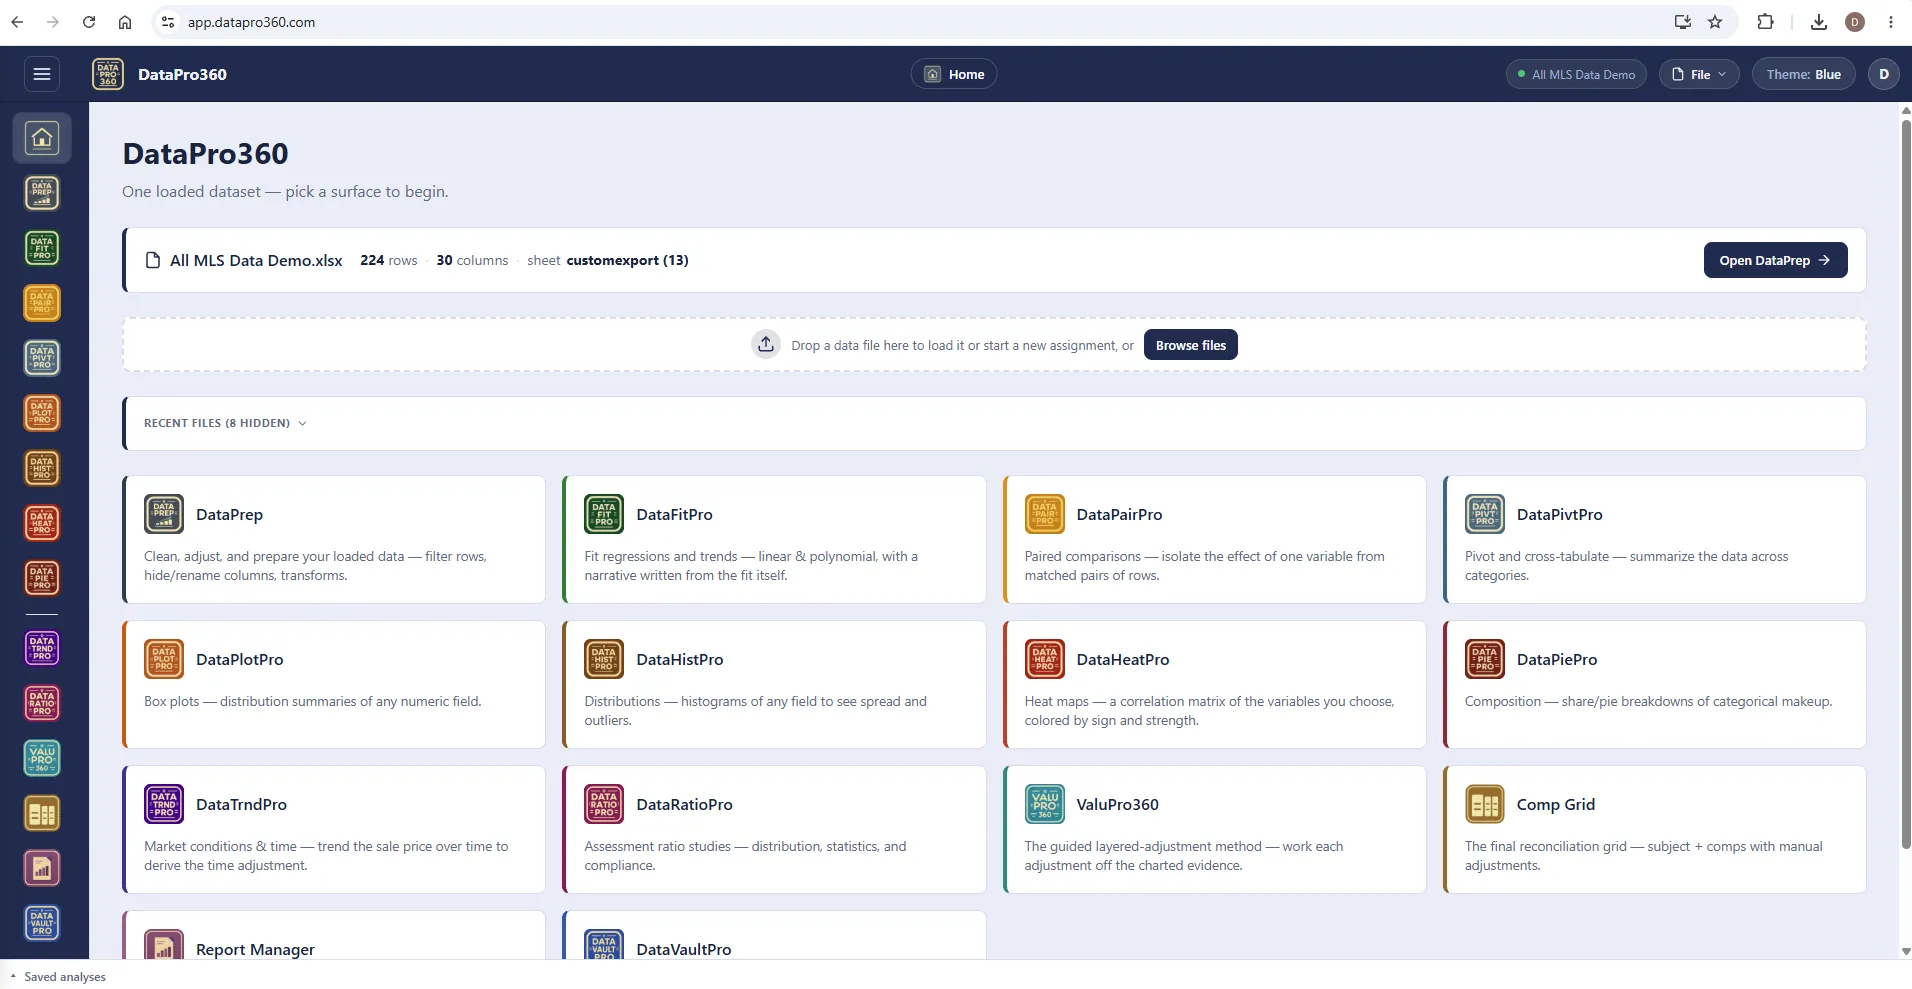
Step 1 of 5
Load your MLS export
Home, then the file picker. Excel or CSV — the export as it came from your MLS. The dataset chip in the top bar shows what is loaded, and the file on disk is never modified. Sales you keep in DataVaultPro arrive the same way: filter the collection, load the result. Or let a connected assistant stage sales into your account — they wait in your import queue until you load them.
 DataVaultPro
Out the other end: One loaded dataset that every surface reads.
Step 2 of 5
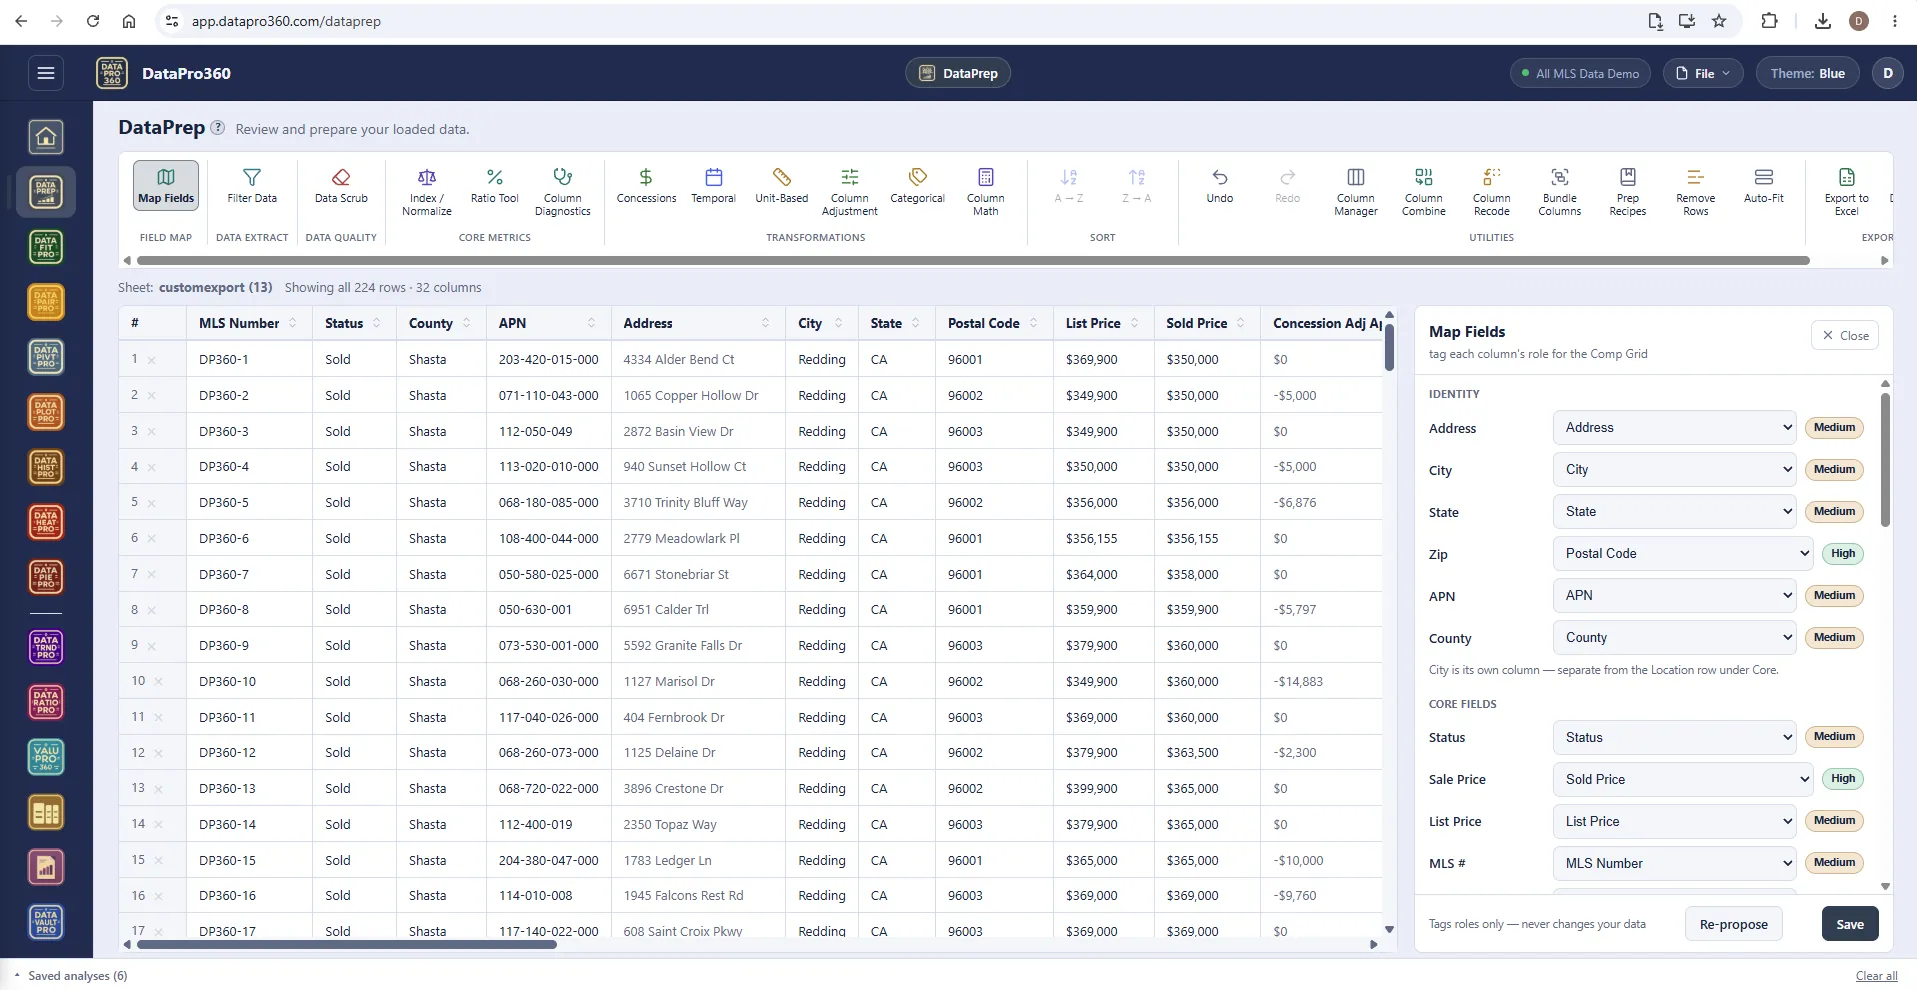
Prep the data
DataPrep, then Map Fields. The program proposes a mapping by reading your column names, and it is usually close. Confirm the sale price, the dates, living area and site size — a wrong mapping is silent and propagates everywhere, so this is the one step worth being slow about. Filter the statuses that do not belong, scrub, recode, compute what is derived, and save the steps as a recipe for next month's export.
 DataPrep
Out the other end: A prepared dataset with every column's role tagged — the stations solve against the bases it built.
Step 3 of 5
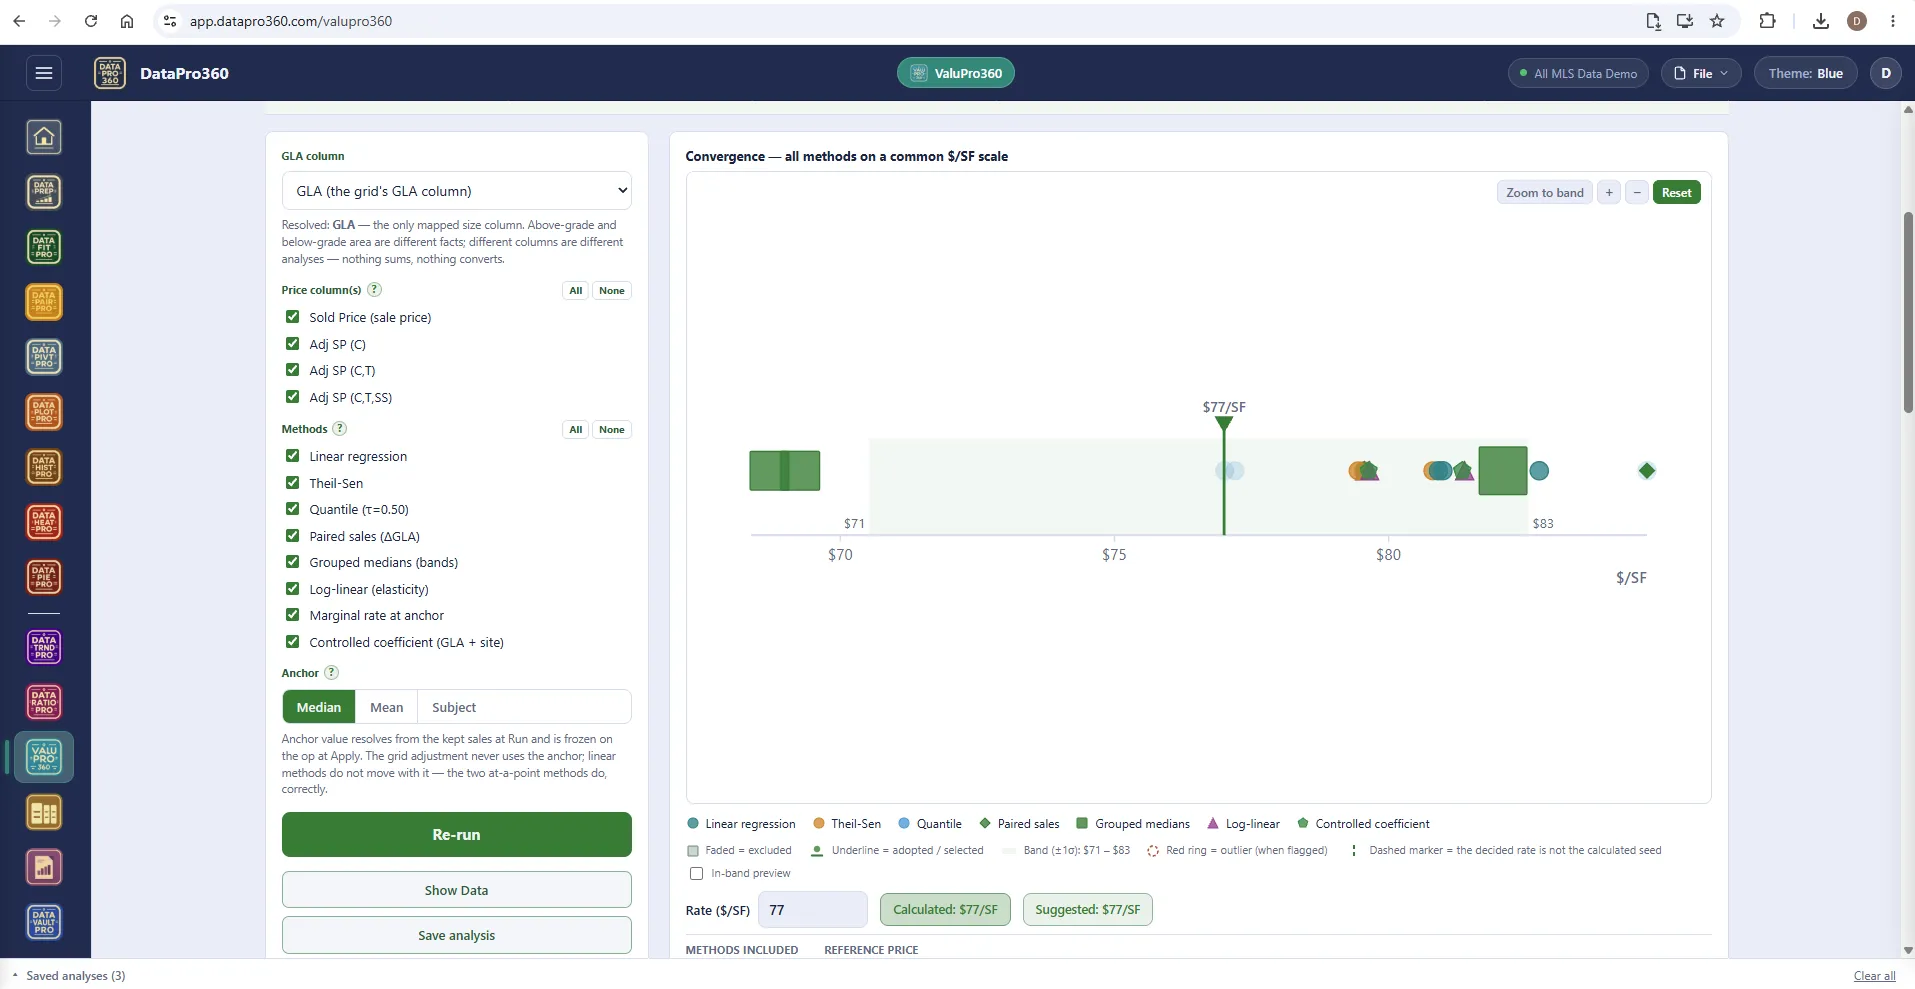
Measure every adjustment
Thirty seconds in DataHistPro on sale price tells you whether you have one market or two. Then ValuPro360: Concessions, then Time, then Site Size, then GLA, then Amenities. Each station runs every method that fits the data, lays them on one scale, and asks for a decision — adopt a rate, override it, or apply the calculated value. Save each analysis when you decide it. DataTrndPro carries the time work in depth; the free-form tools prove whatever else the assignment asks.
 ValuPro360
 DataTrndPro
 DataHistPro
 DataFitPro
Out the other end: A decided rate per layer, each with its evidence, published to the grid.
The Adjustment Library
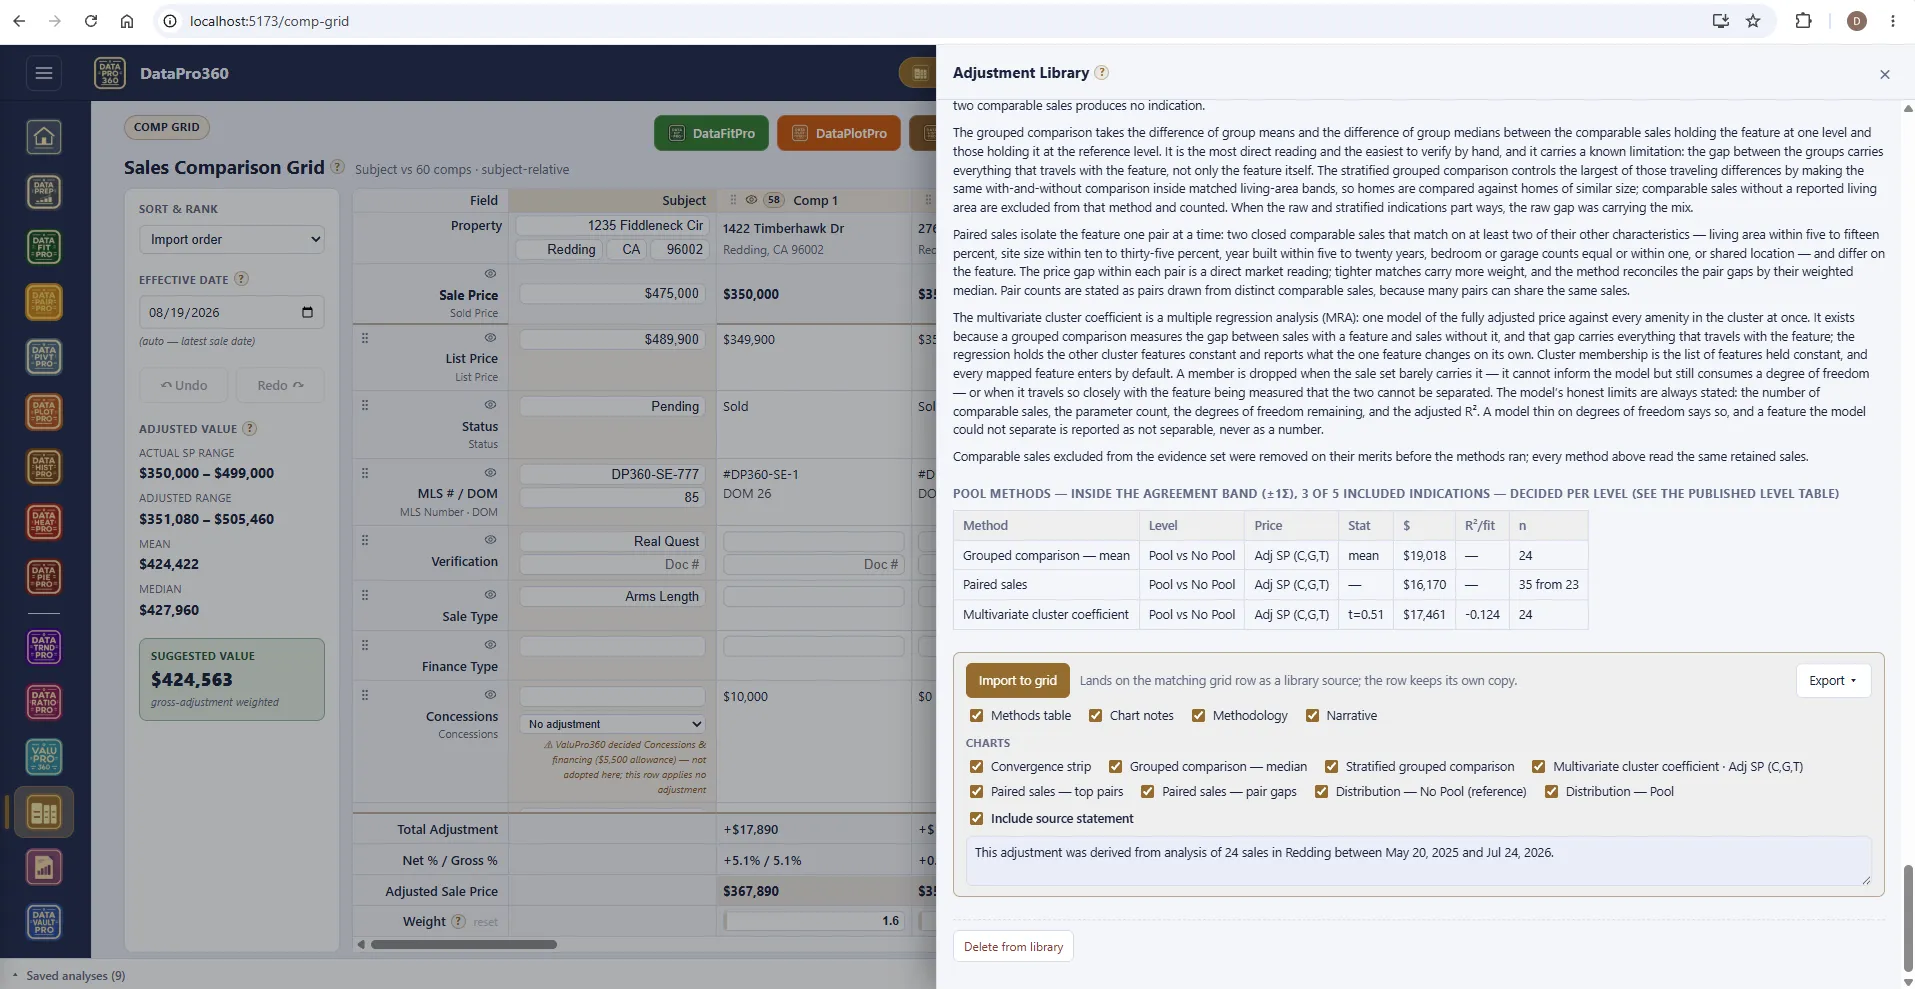
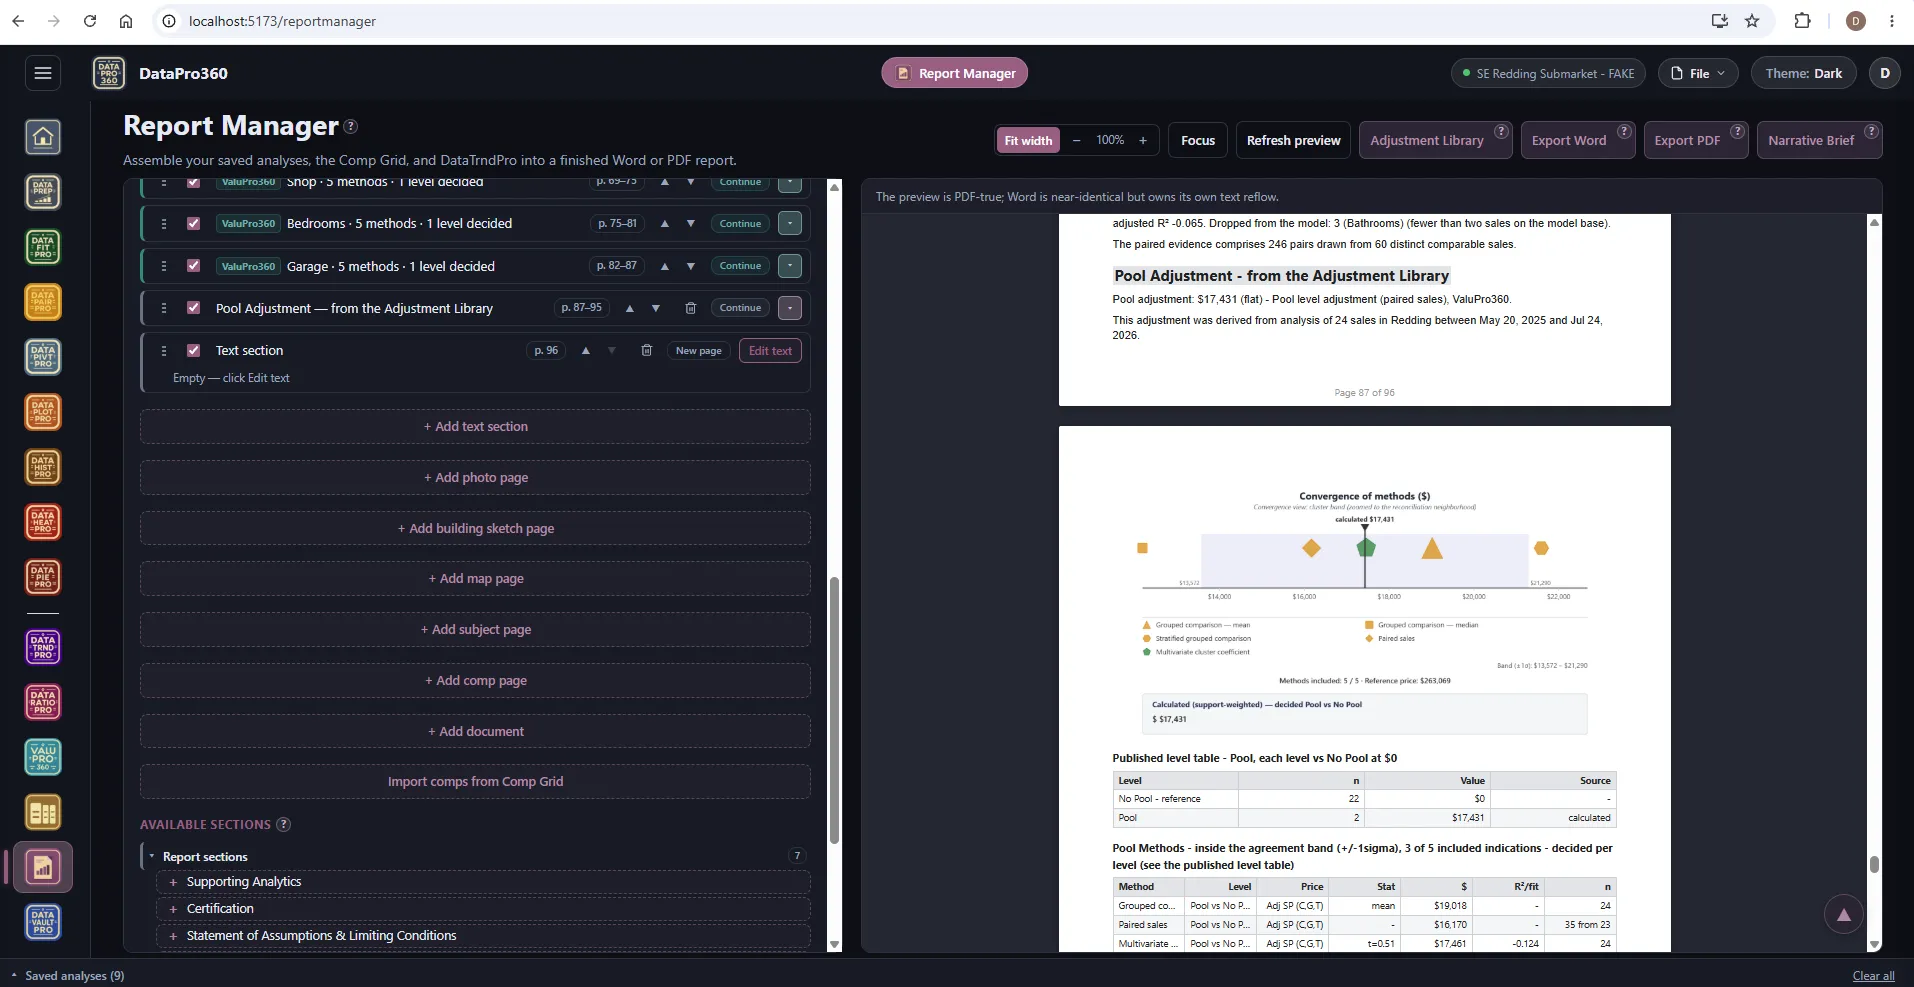
Some rates you will use again. A market-conditions rate for a submarket you work every week, a garage or pool value in a county you know, a dollar per square foot you supported from sixty sales last quarter. Save one the day you decide it and it keeps its whole case — the figure, the method, the sales behind it, and the charts.
Import it into the next assignment and it arrives as a section of support with its source stated, not as a bare number. Rates travel; dollars do not — the new assignment's own sales produce those.
Step 4 of 5
Build the grid
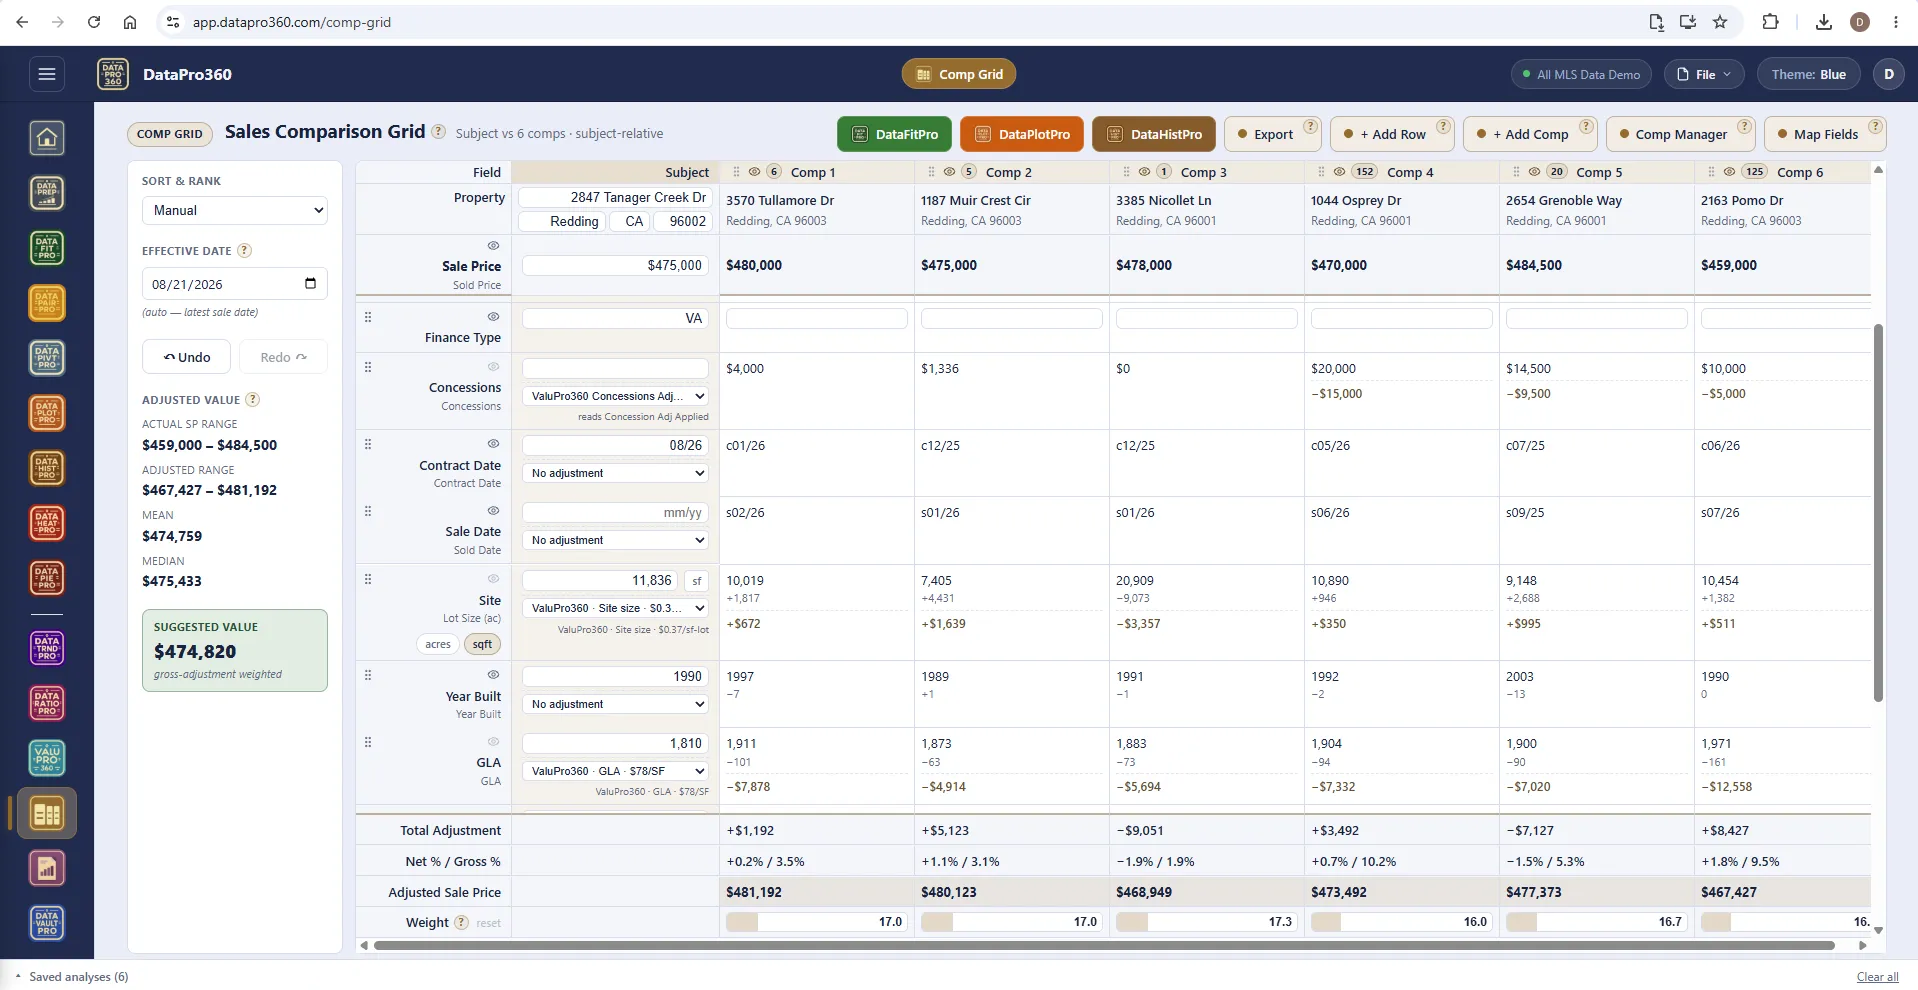
The adjustments you decided are already there, each row naming its source. Add the subject's facts, select your comparable sales — from the dataset, the vault, or typed in — weight them, and read the adjusted range. Open a box plot or a histogram on your own comps to see where the subject falls; check the gross adjustment, not just the net.
 Comp Grid
Out the other end: A reconciled grid — the arithmetic and the documentation — and a value conclusion that is yours.
Step 5 of 5
Assemble the report
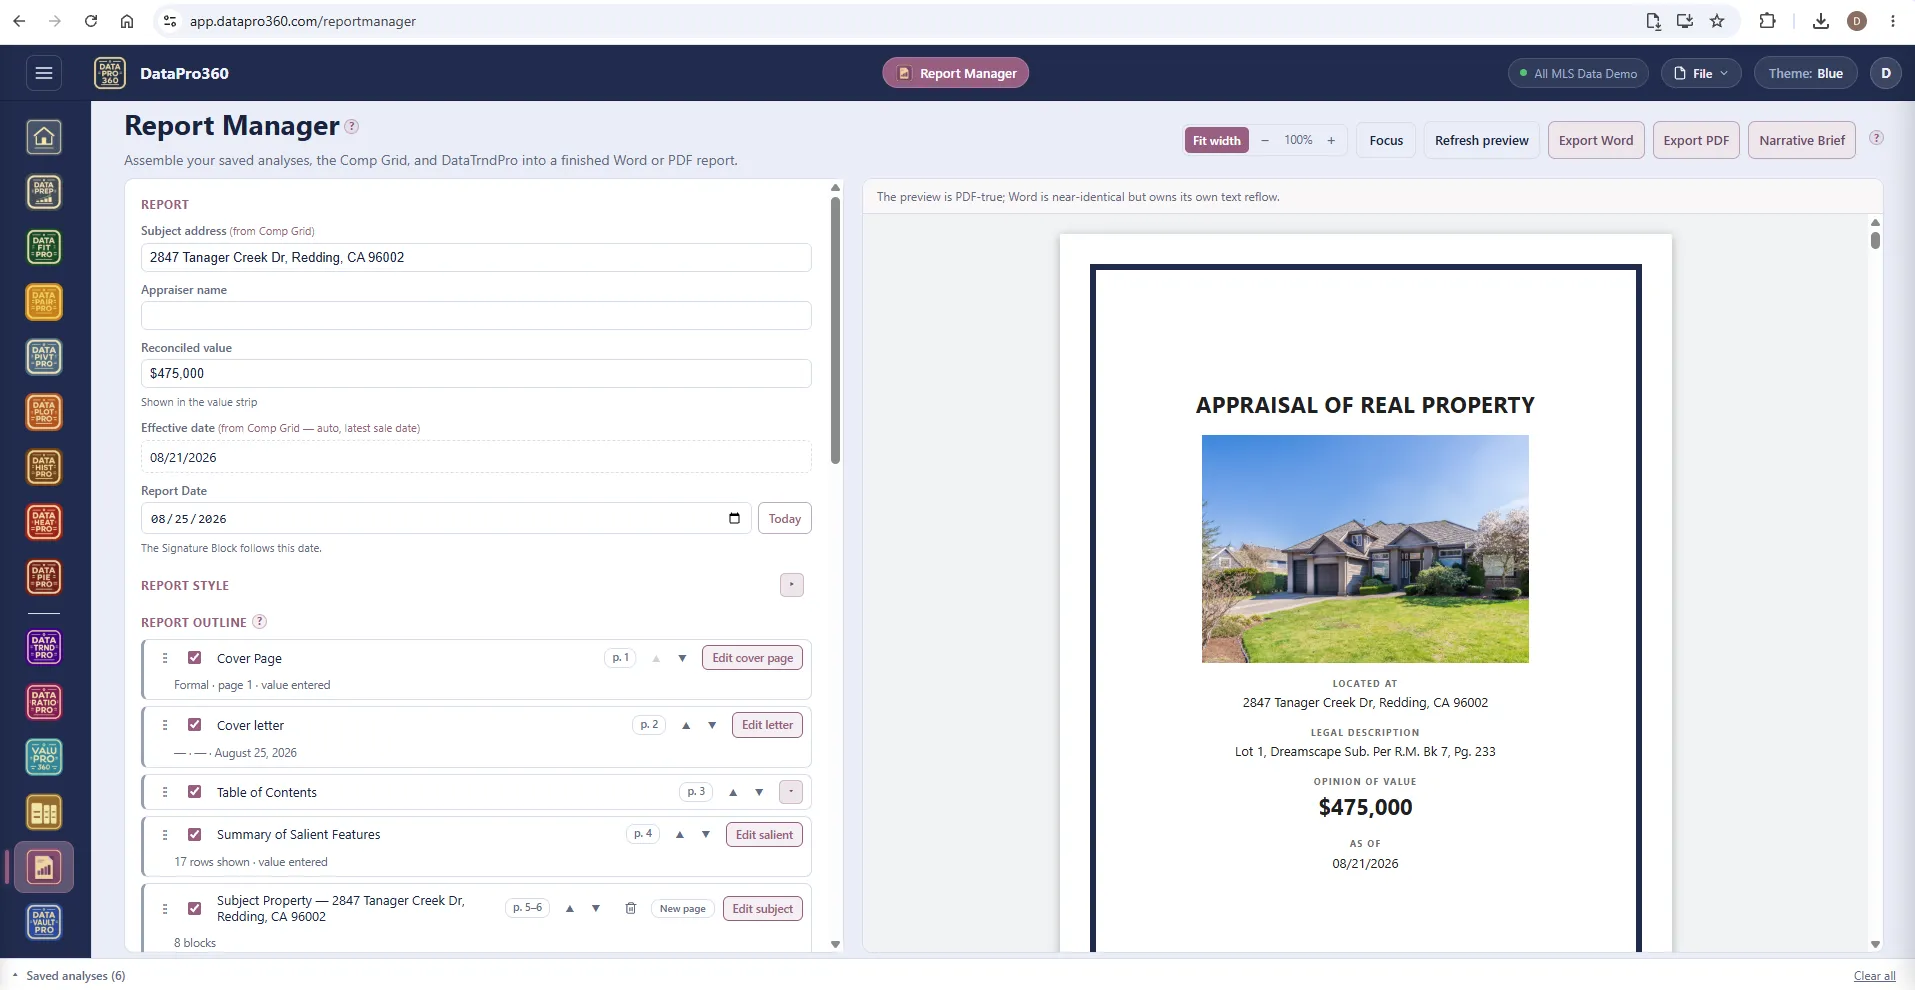
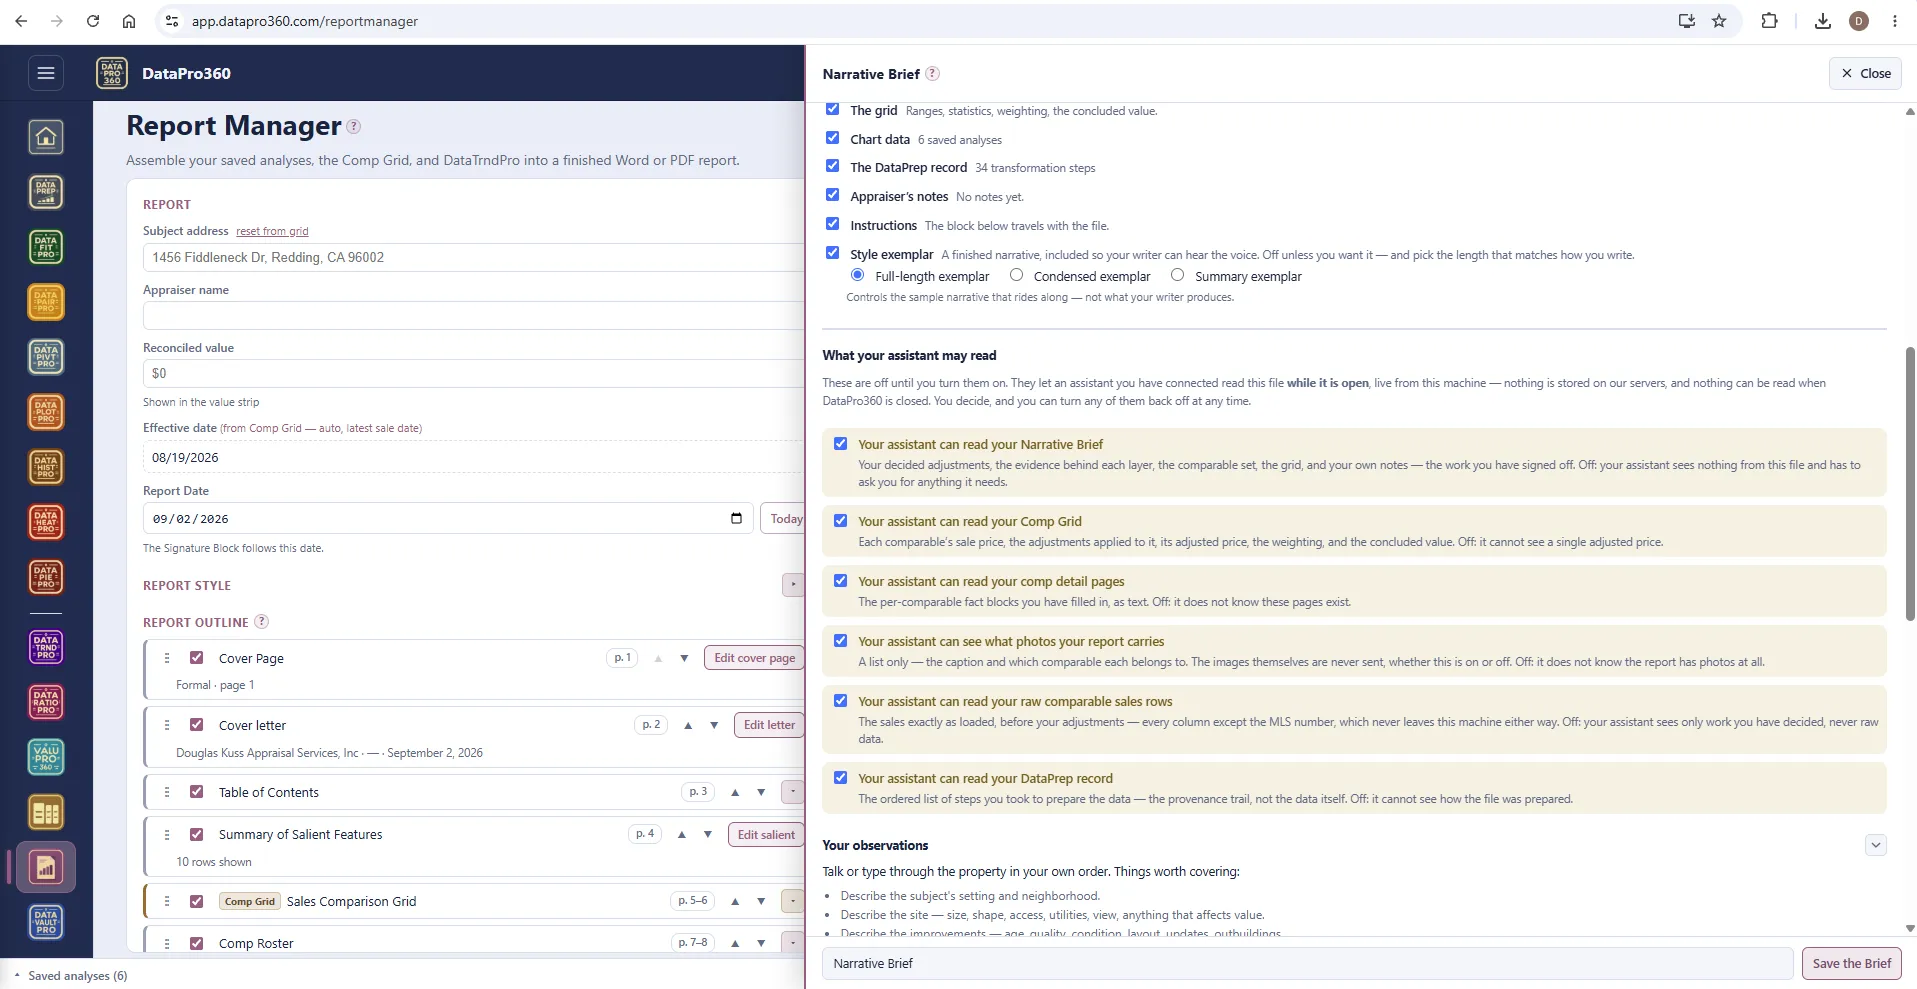
Your saved analyses are available as sections. Order them, add the sections the assignment needs — cover page, cover letter, table of contents, salient features, subject and comp pages, photos, certifications, the signature block — import an inspection report or engagement letter as a section, and export to Word or PDF. The letterhead and signer come from the Business Center.
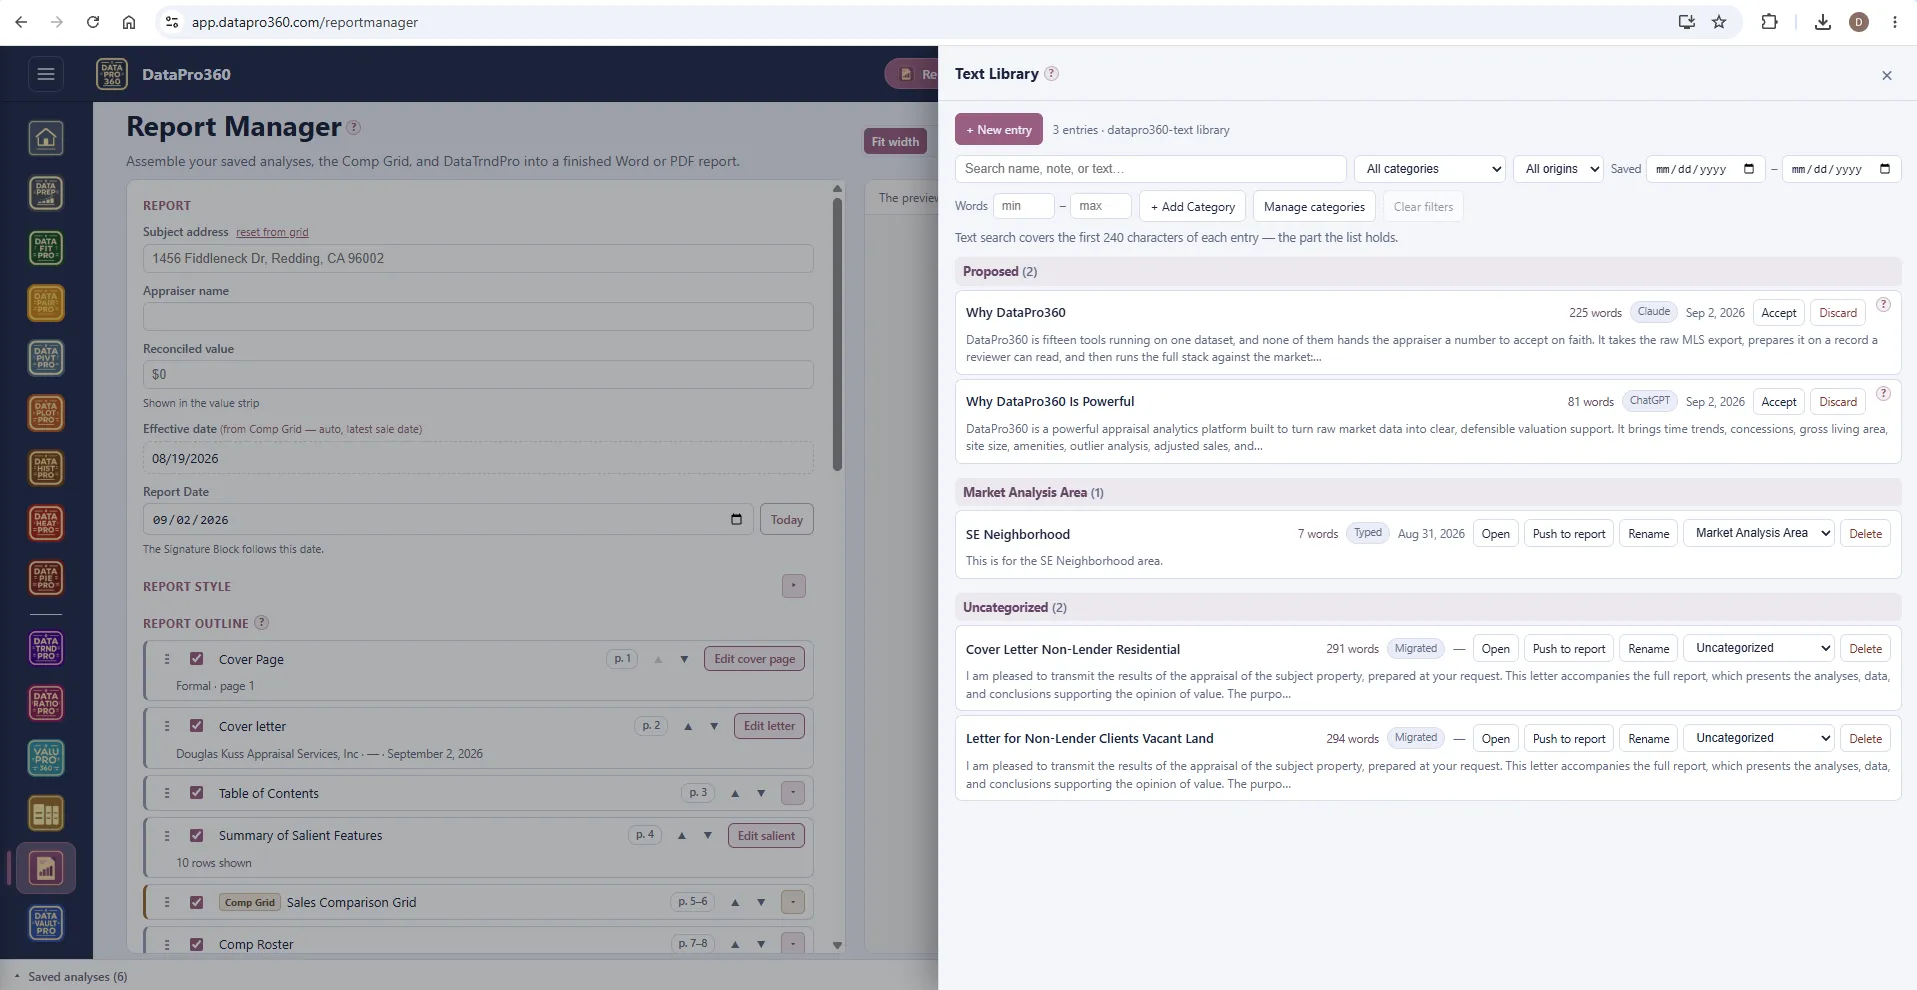
The Text Library holds the prose you reuse — neighborhood paragraphs, cover letters, certification language — typed, spoken, or saved from any field. Push an entry into any text section, or import it into any prose field, and it arrives as an addition, never a replacement.
 Report Manager
 Business Center
Out the other end: A finished Word or PDF report — or the exhibits, into whatever form platform you already use.
Bring your own assistant.
Claude and ChatGPT connect to DataPro360 through MCP, under your own account with that provider. Once connected, the assistant can read the parts of your open file you switch on in the Narrative Brief — the Brief itself, the grid, the comparable sales, the comp pages, the photo list, the prep record — live from your machine, only while the file is open, and nothing you haven't switched on.
Ask it to draft from what it read and send the draft over. The text lands on a review shelf in your Text Library with the assistant's name on it. Accept it and it's yours to edit and push into a report section. Discard it and it's gone. The assistant cannot write into a report, cannot run an analysis, and cannot change your data.
It can also stage comparable sales into your account from the MLS connection you already have in the assistant, and it reads the program's own documentation, so it can tell you how a tool works from the manual rather than from memory. DataPro360 has no AI of its own; the one you connect is your provider, under your terms with them.
The end of the walk
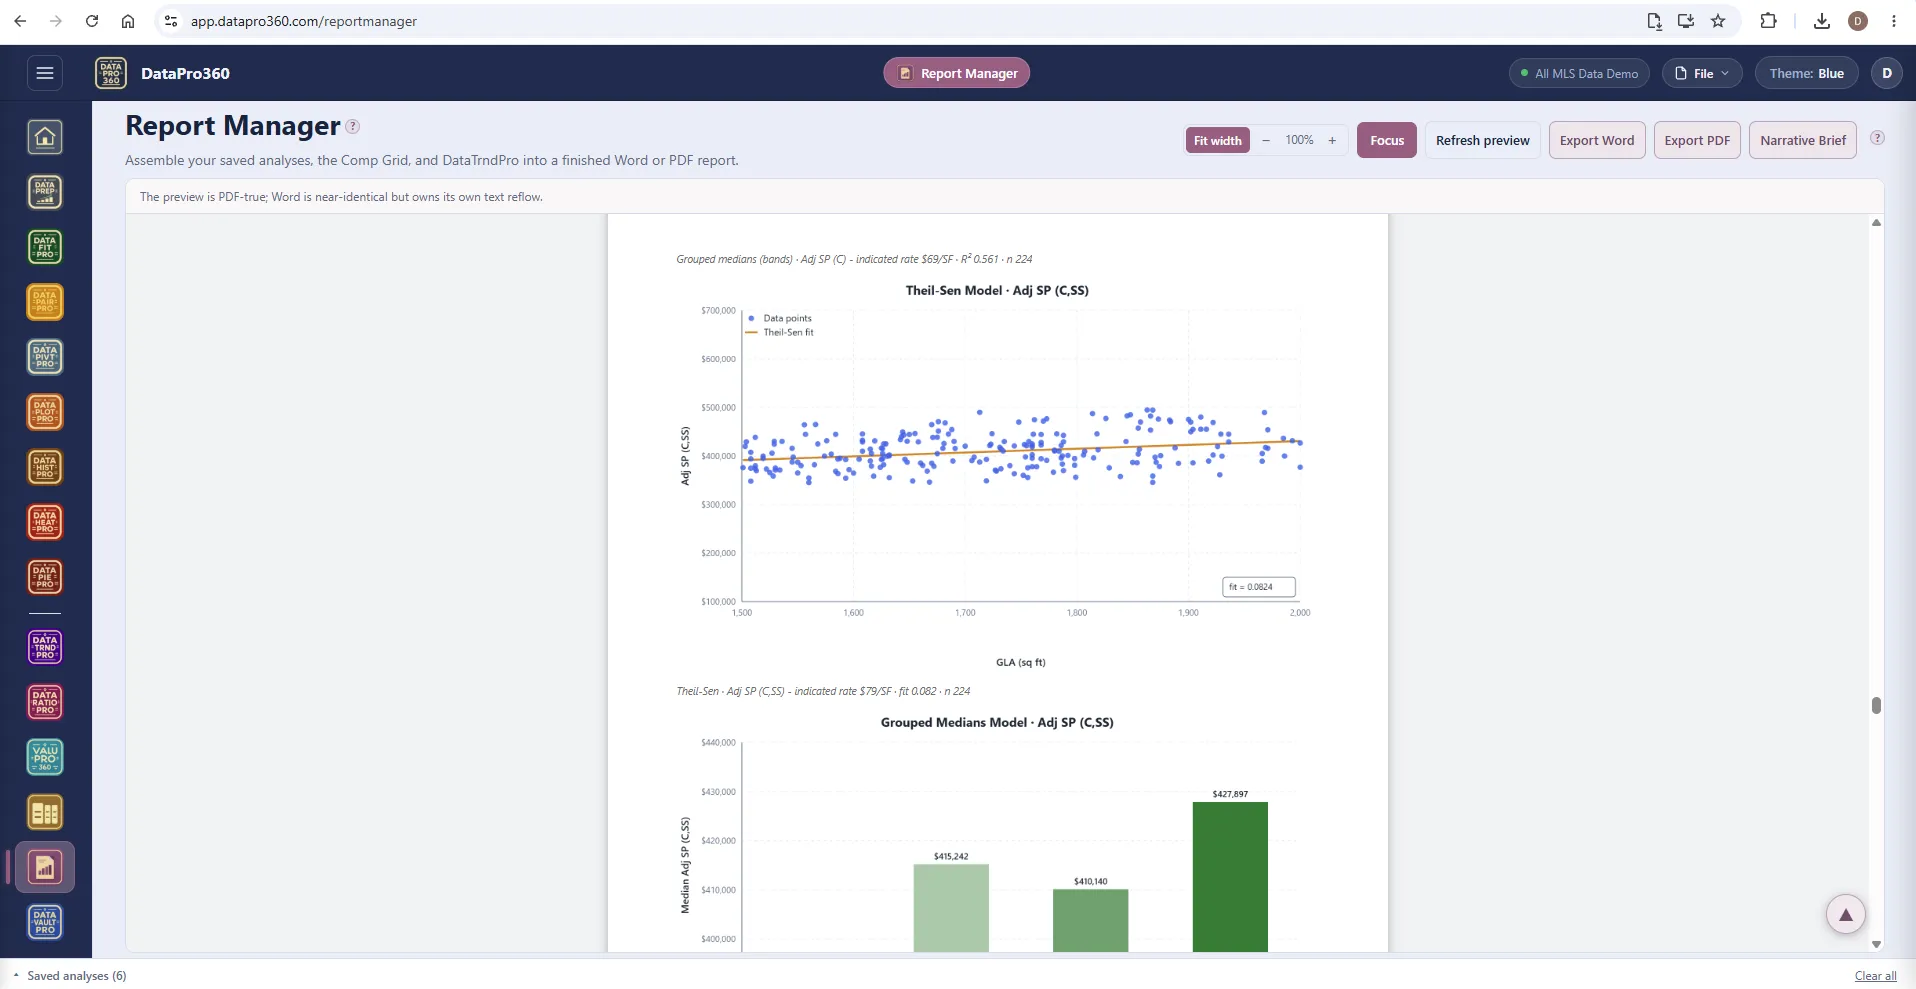
The finished report.
Every chart as you styled it, every method with its n, every decision stated with how it was made. The generated prose describes the measurement; the judgment — why you excluded a method, what verification established, why you concluded where you did — is yours, and the report says so. Nothing is a black box: every number the program produces shows what produced it.
The worked example in Support walks one assignment start to finish with every decision explained. It is worth an hour before you work your first live file.
See the training ground →Prove the numbers in your next report.
Load your own MLS export and work a real assignment through the trial — every chart, every method, the finished report.
$69.95 per user, per month. 30-day free trial, no credit card required. No long-term contract.