
DataTrndPro
Market conditions and time — where the methods converge on the time adjustment.
Market conditions — trend prices over time to derive the time adjustment.
What it does
DataTrndPro measures how a value changed over time. You have records with dates and values; DataTrndPro fits several models to that relationship, slices the data into windows, detects points where the trend changed, and reports a rate of change in the unit you choose — dollars or percent per day, month or year.
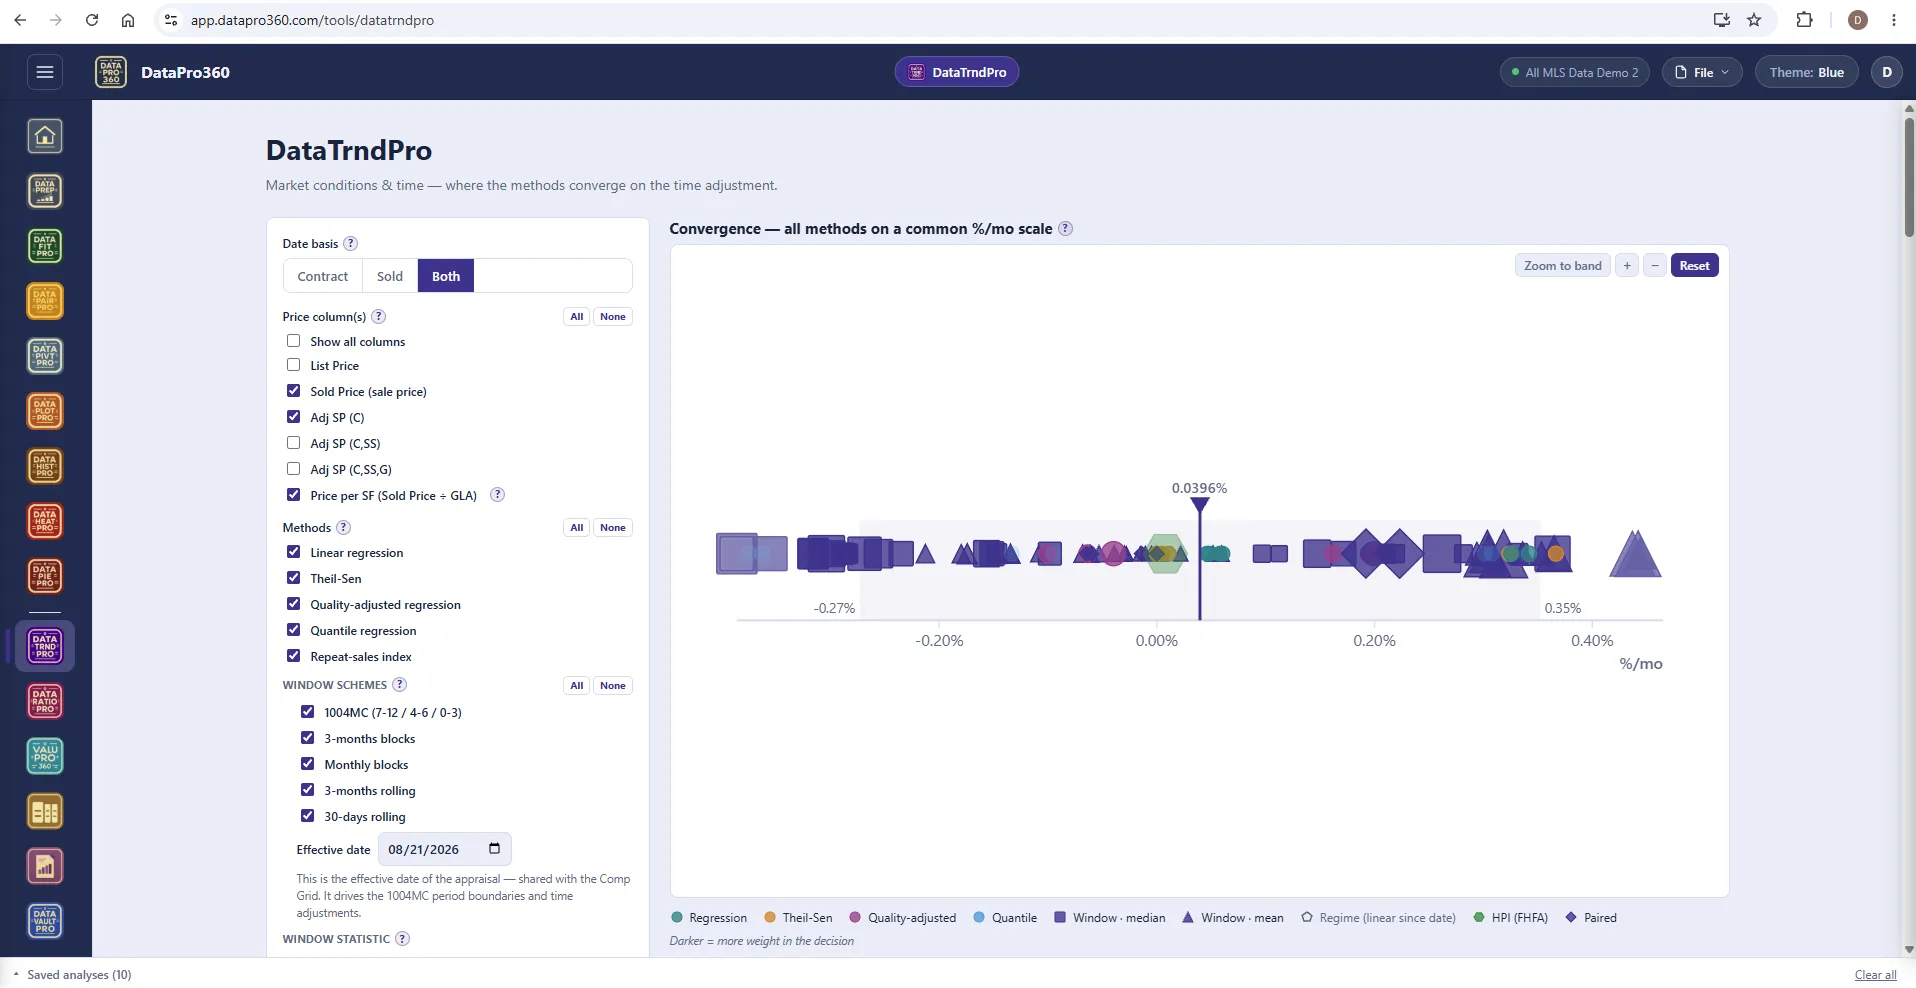
What you get: a chart with the fitted trend, a convergence strip comparing every method on one scale, a methods table, the charts behind each method, and a written narrative. Run several methods, look at whether they agree, and treat their agreement as the finding rather than any one of them. A rate several independent methods agree on is a rate you can rely on; a rate only one method produces depends on that method's assumptions holding.
Two outlier controls, kept separate: flagging marks a record so you can see it; excluding removes it from the evidence — and flagging never excludes. The 1004MC exhibit is a census, not a model: every settled sale in each period is counted and the statistical screens do not apply to it, by design. Two exhibits, two questions, two answers.
External benchmarks — the FHFA house-price index, Freddie Mac mortgage rates — enter as context and corroboration, born excluded on a fresh run because they describe a broader population than yours. It is the most control-dense surface among the tools, and every control has a reason. The decided rate carries to the Comp Grid's time-adjustment rows, overridable there like every other adjustment.
Every method on one scale.
Date basis — contract, sold, or both. Price columns — sold price, the adjusted bases, price per square foot. Linear regression, Theil-Sen, quality-adjusted and quantile regression, a repeat-sales index, and the window schemes: 1004MC periods, three-month and monthly blocks, rolling windows. Each reads the same closed sales a different way; the strip shows where they land, darker for more weight in the decision.
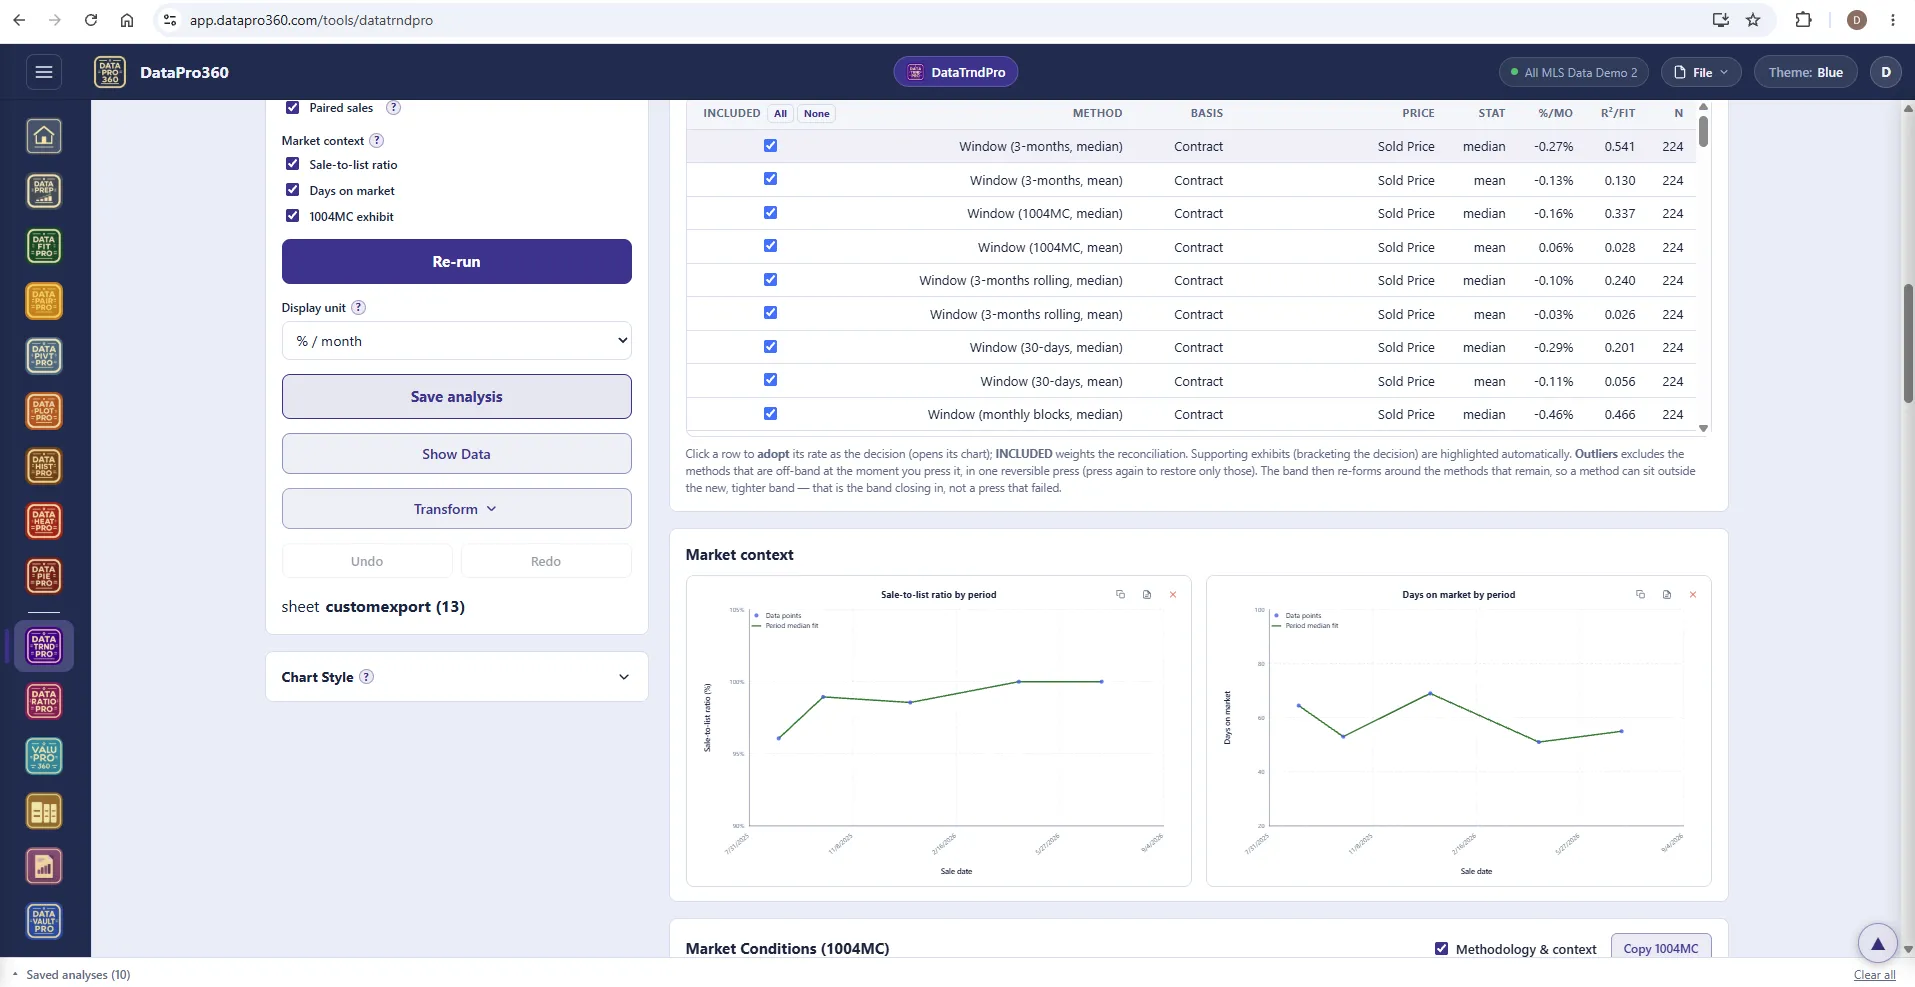
The methods table and the market context.
Each window method with its basis, price column, statistic, rate, fit and n. Below it the market-context exhibits — sale-to-list ratio by period, days on market by period — and the 1004MC grid with its methodology paragraphs, ready to copy into a form report.
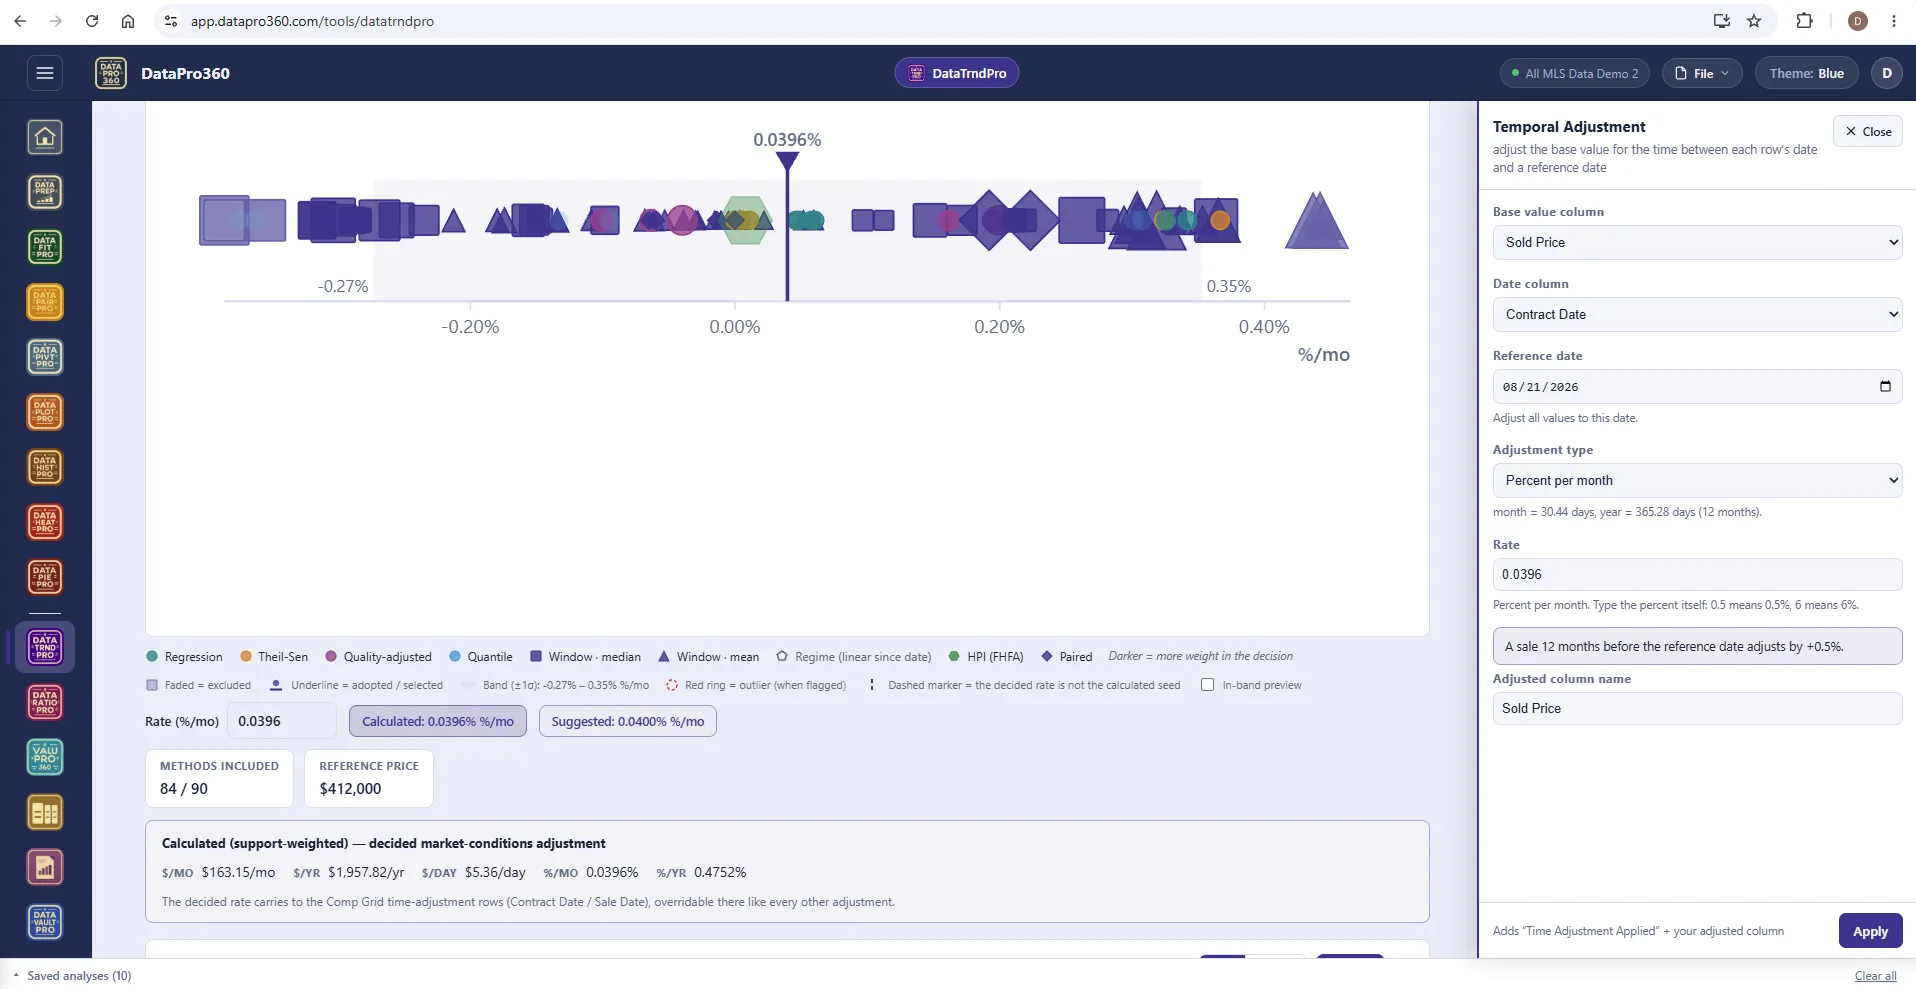
Apply the decided rate.
Transform opens the Temporal Adjustment: base value column, date column, reference date, percent or dollars per month, the rate — and a plain sentence stating what a sale twelve months before the reference date will adjust by. Apply writes a Time Adjustment Applied column and your adjusted column, and every other surface sees them.
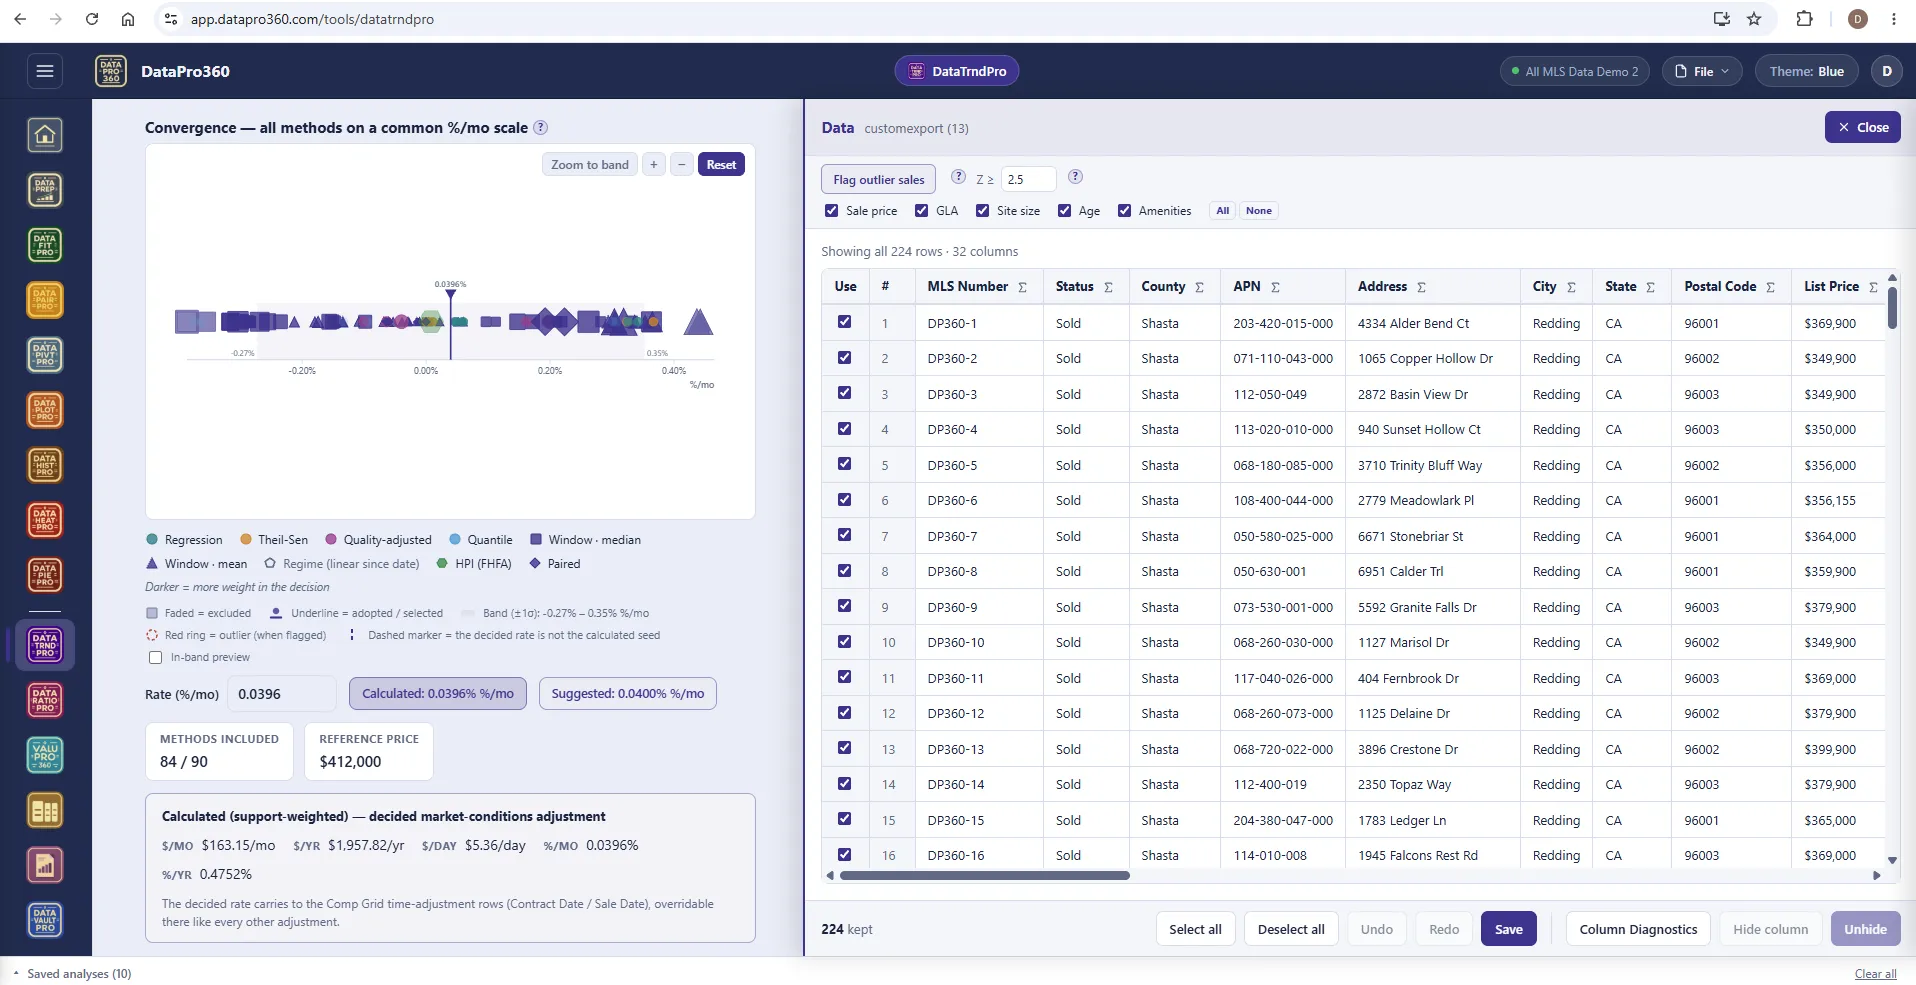
Show Data — the rows behind the strip.
Flag outlier sales at a z-score you choose across sale price, GLA, site size, age and amenities; uncheck a row and everything recomputes — chart, statistics, narrative — with no apply button. Column diagnostics, hide columns, undo and redo, and a count of what is kept.
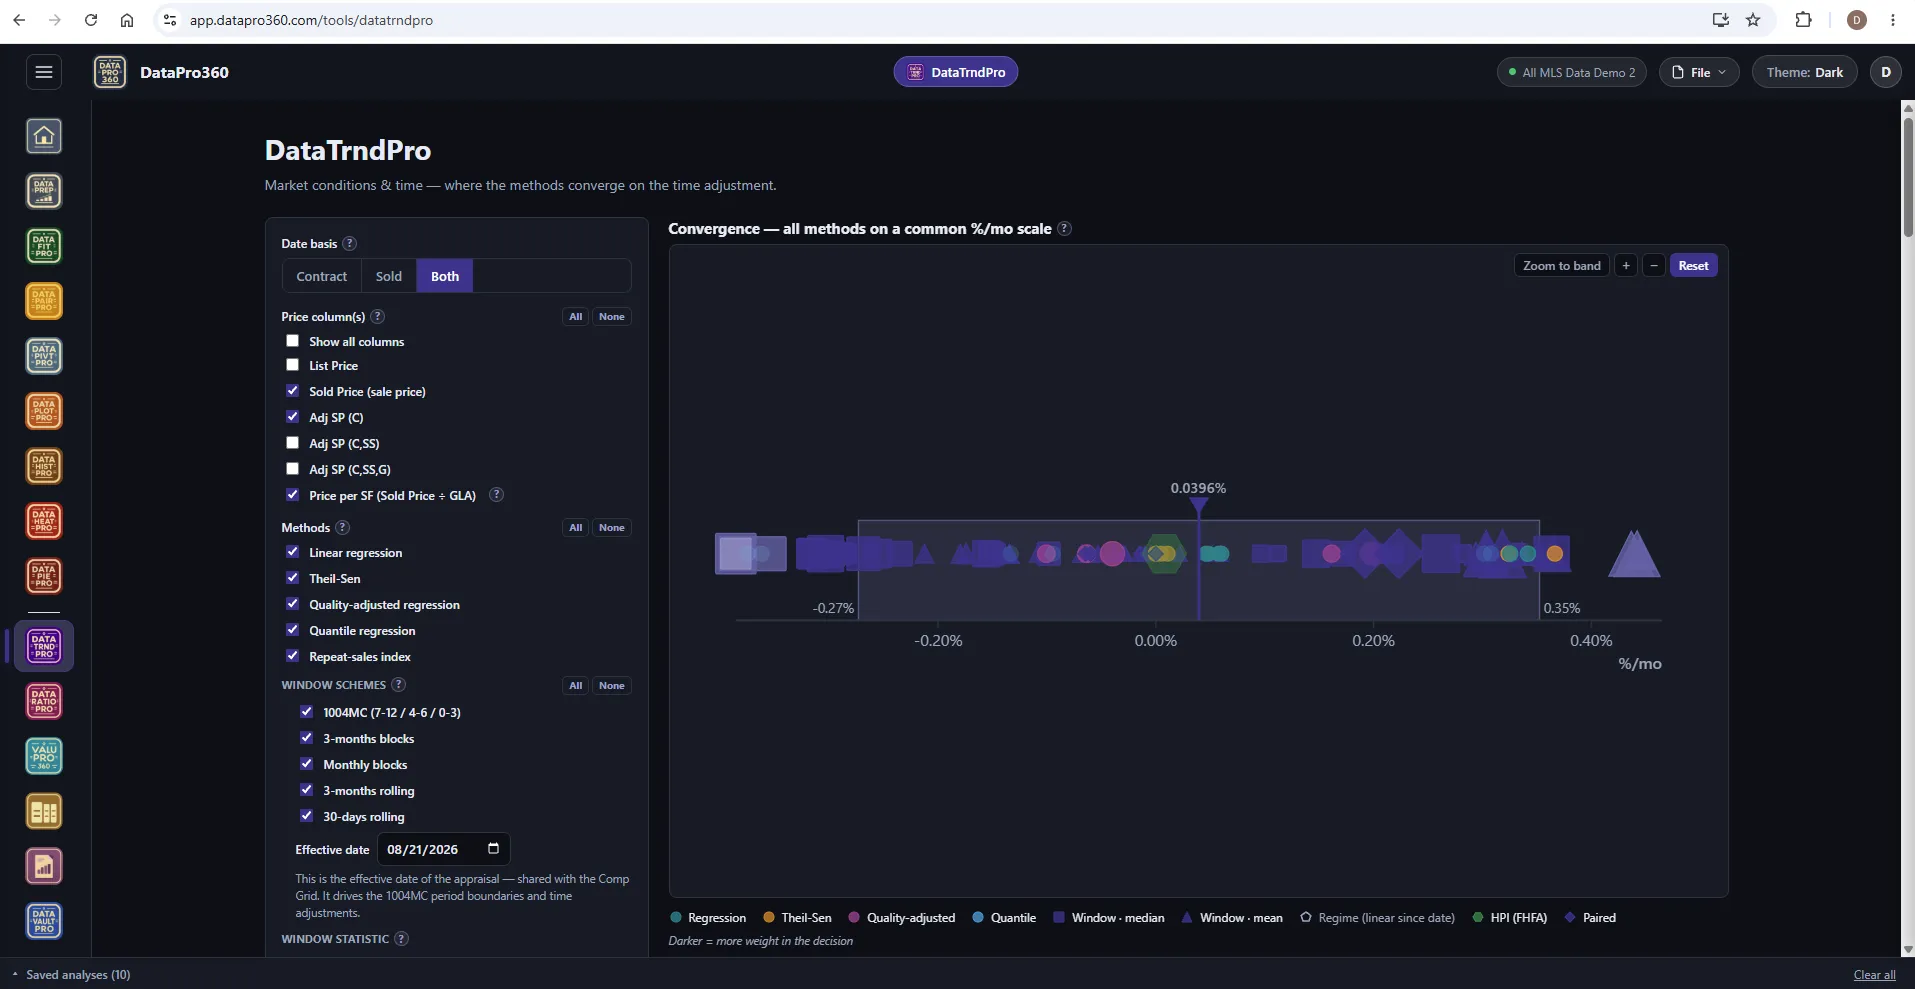
The same strip in the Dark theme.
Every method, every marker, the same reading in Blue, Light or Dark.
Where it sits
In the workflow
DataTrndPro reads the prepared dataset. Its decided rate feeds the Comp Grid's time-adjustment rows and the ValuPro360 Time station shares its methods; a saved run carries into Report Manager with every chart verbatim.
See the whole workflow →Before
 DataPrep
 ValuPro360
 Comp Grid
 Report Manager
Prove the numbers in your next report.
Load your own MLS export and work a real assignment through the trial — every chart, every method, the finished report.
$69.95 per user, per month. 30-day free trial, no credit card required. No long-term contract.