
Report Manager
Assemble your saved analyses, the Comp Grid, and DataTrndPro into a finished Word or PDF report.
Assemble narratives, charts, and the comp grid into a finished Word or PDF report.
What it does
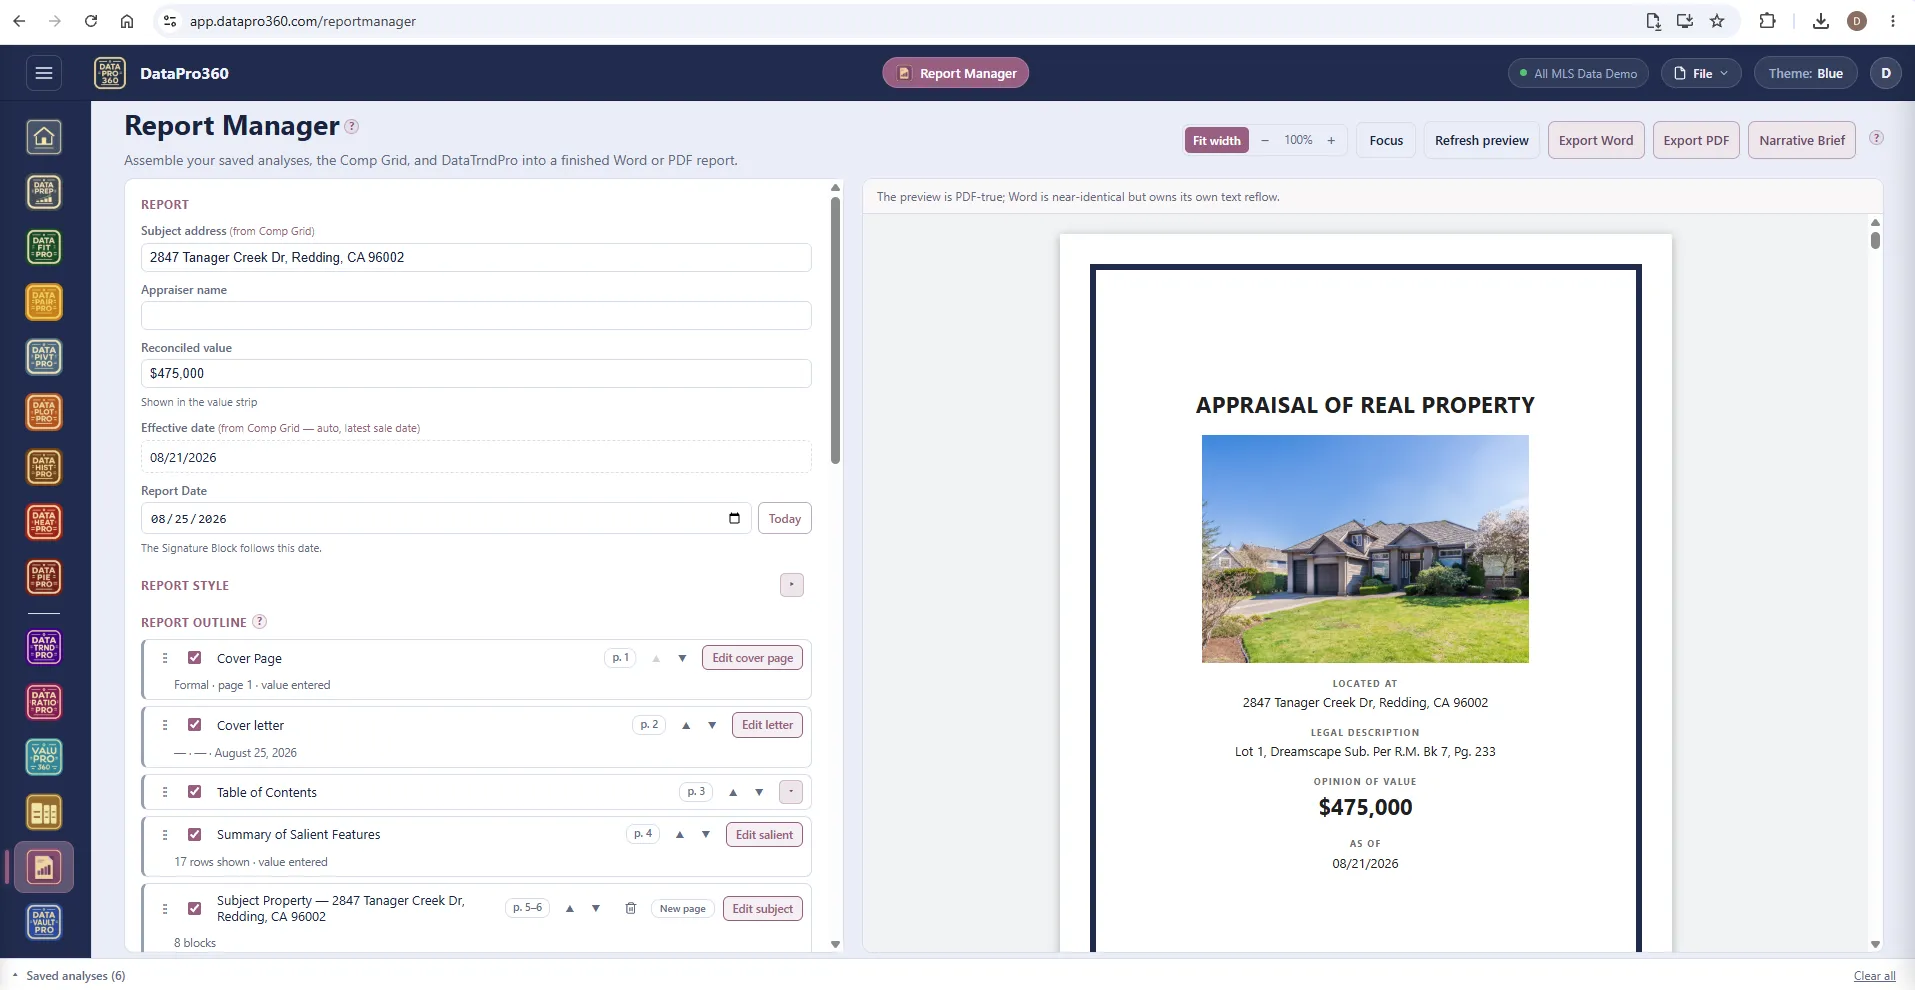
Report Manager assembles the work into the finished document. Saved analyses from every tool and station arrive as sections — narratives, charts, tables, the comp grid — and the outline orders them: drag to arrange, toggle what each section shows, and add your own text sections where the report needs words the tools did not write. The live preview is the document — what it shows is what exports, to Word or to PDF, in the theme you chose.
The document furniture is there when the assignment needs it: cover page, cover letter, table of contents with physical page numbers, summary of salient features, subject property pages, subject photographs, comp roster and comp pages, photo pages, maps, a building sketch page, definitions and scope of work, statement of assumptions and limiting conditions, USPAP identification, certification and the signature block. Grid sections carry the sales comparison grid and the adjustment summary; the reconciliation section states the decision stack and the scenario spread.
Sections stay connected to the work that produced them. Re-run an analysis and save it again, and the report carries the current version; your own text survives the edits around it. Two editions of one report: PDF is fixed layout — what you see in the preview is what prints — and Word is editable, owning its own text reflow. Both carry the same content, the same charts and the same tables.
Two newer doors. Document import brings PDFs and Word documents into the report as sections — an inspection report, an engagement letter, straight into the file. And the Narrative Brief prepares a briefing for whoever writes the narrative — your own AI chatbot, a trainee, or a staff writer — carrying only what the program holds, with client, borrower, lender, loan, file and MLS identity stripped by construction. DataPro360 sends nothing anywhere; you save the file and hand it over yourself.
- Export Word · Export PDF · PDF-true preview
- Outline: drag to order, page ranges, toggle what each section shows
- Cover page, cover letter, TOC, salient features, subject and comp pages
- Photos, maps, building sketch, certifications, signature block
- Document import — PDF and Word into the report as sections
- Narrative Brief — a briefing file for your writer, identity stripped
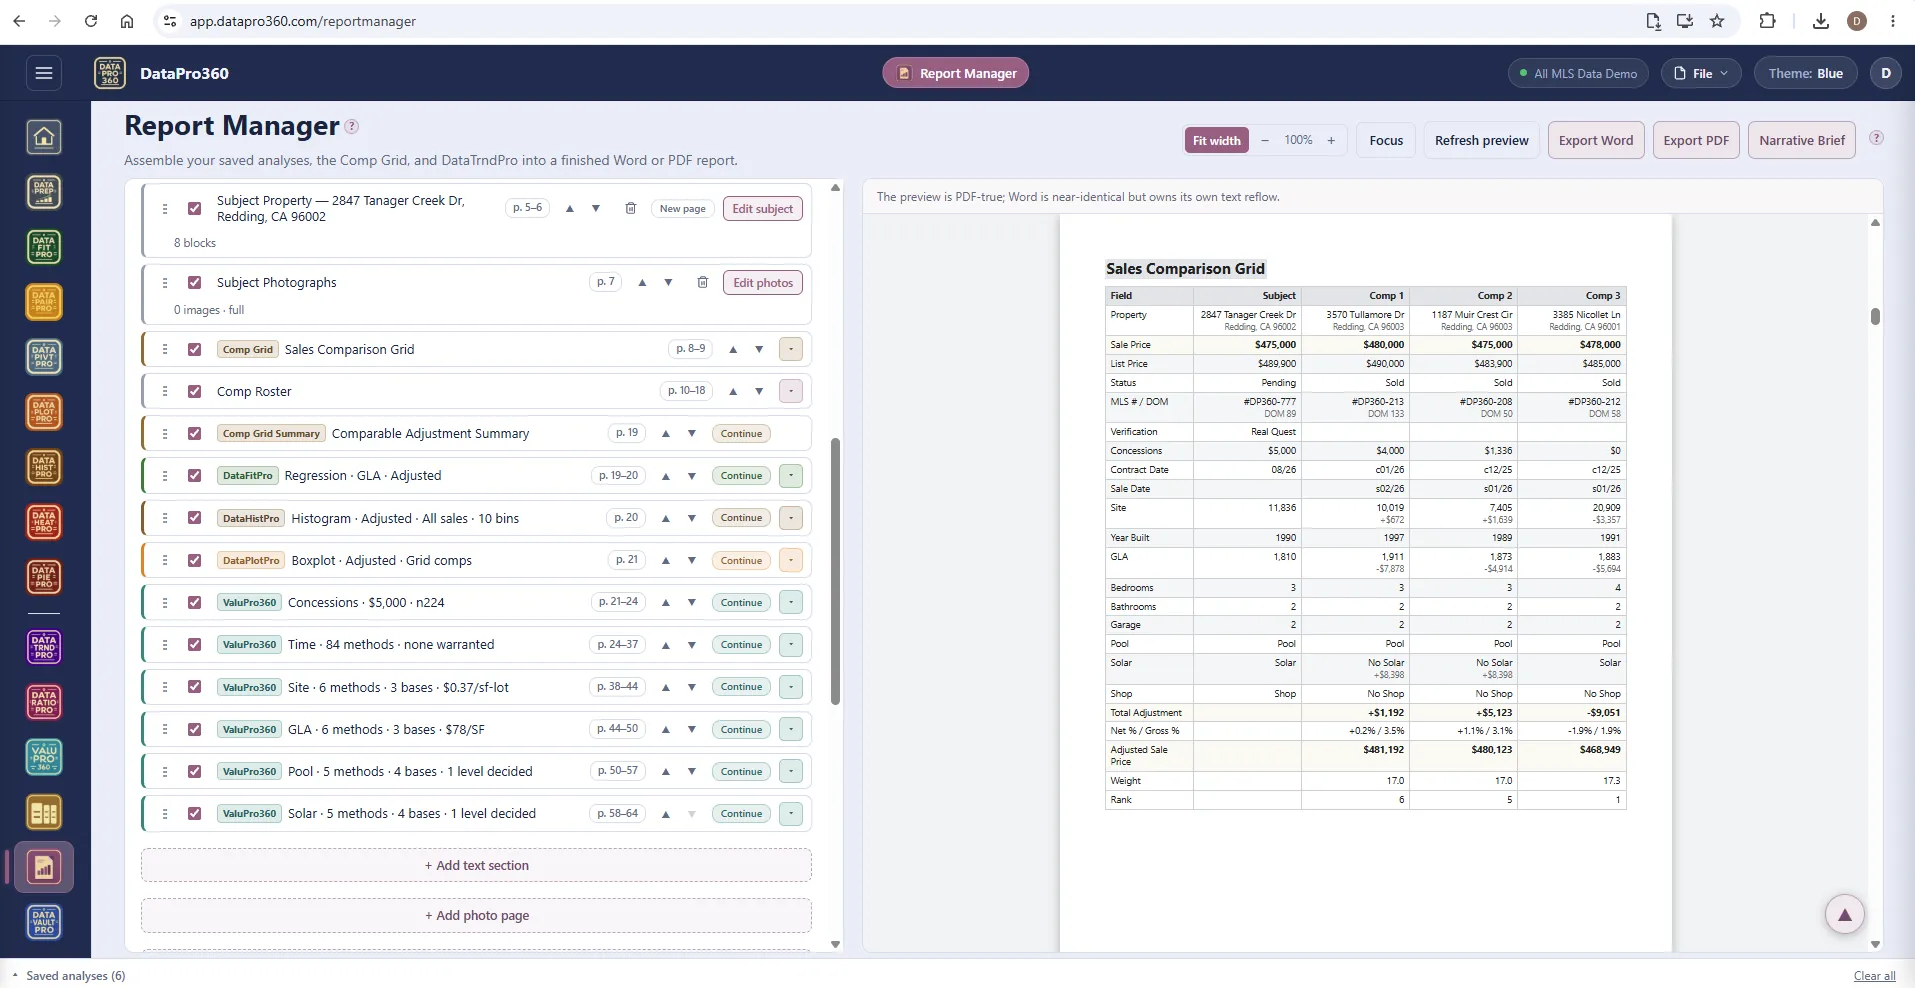
The outline, and the grid on the page.
Every section with its page range and its own controls: the subject property, subject photographs, the sales comparison grid, the comp roster, the adjustment summary, then the saved analyses — DataFitPro, DataHistPro, DataPlotPro and the ValuPro360 stations in order. The preview on the right is the sales comparison grid as it will print.
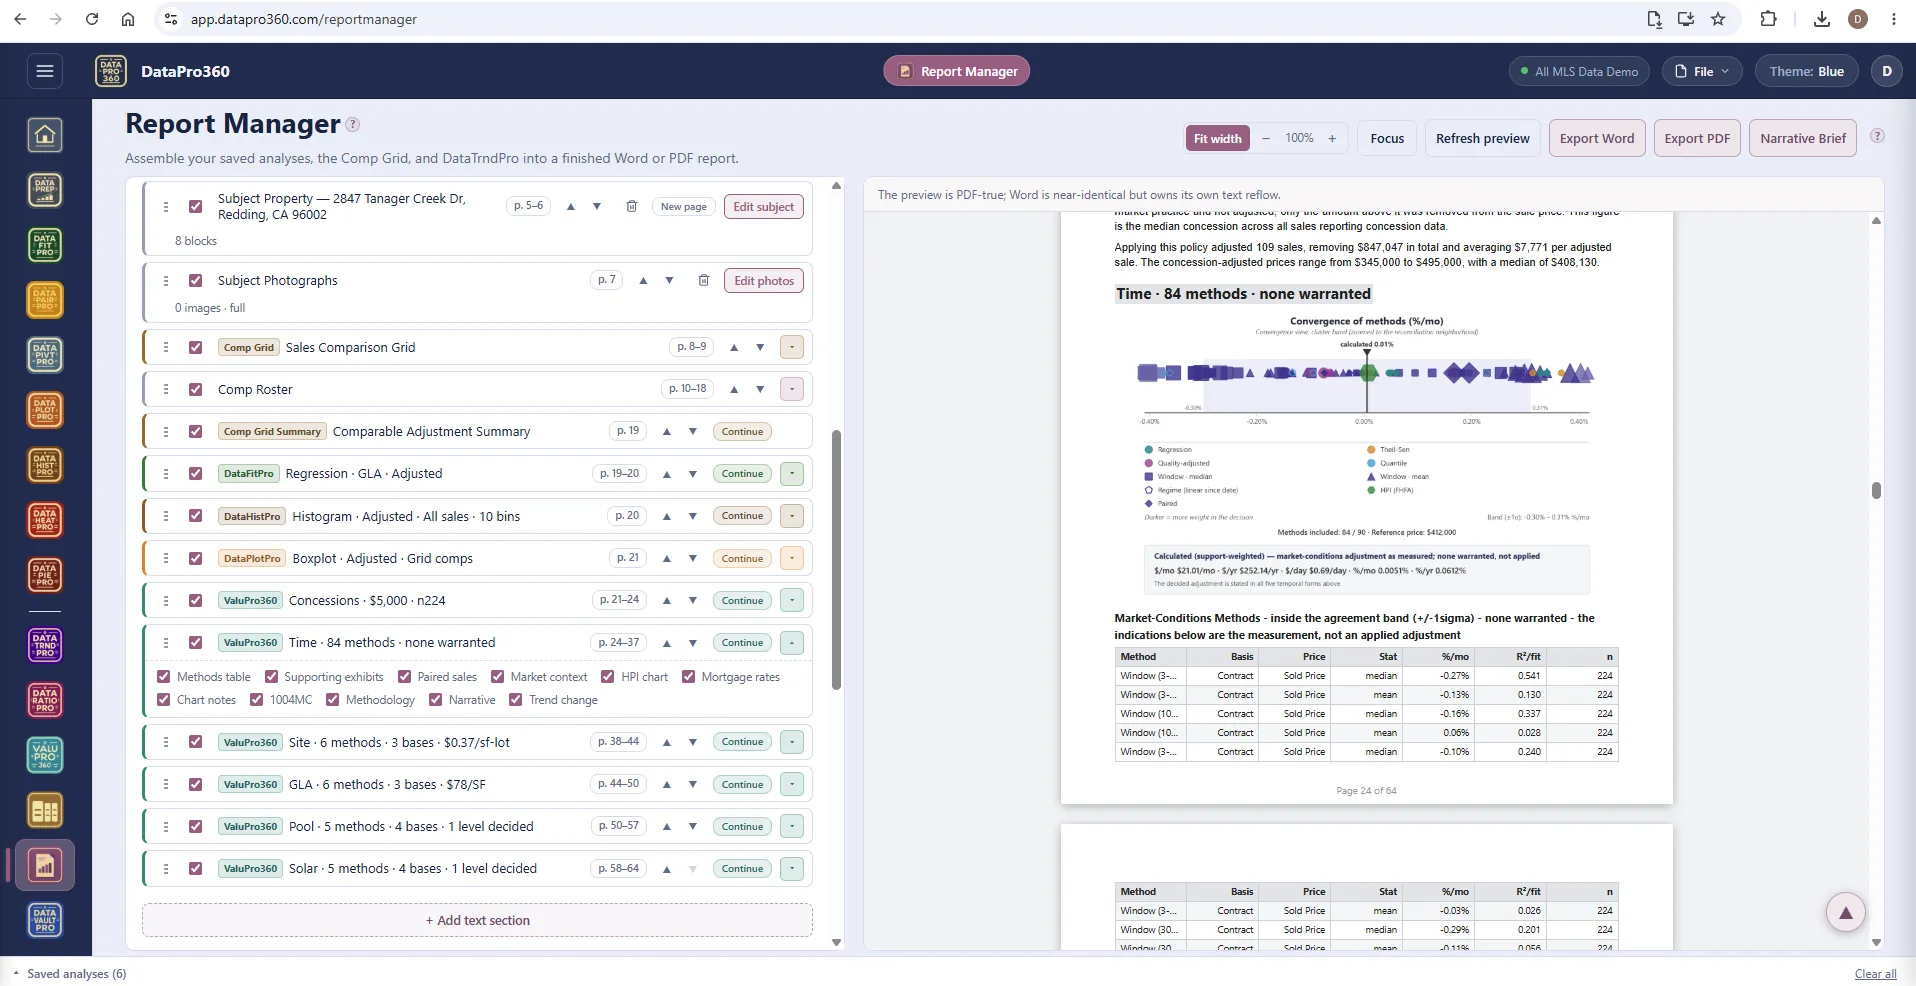
A station section — every layer a toggle.
Open a ValuPro360 section and choose what it carries: methods table, supporting exhibits, paired sales, market context, the HPI chart, mortgage rates, chart notes, the 1004MC, methodology, narrative, trend change. The convergence strip prints on the page with the decided rate stated in every temporal form.
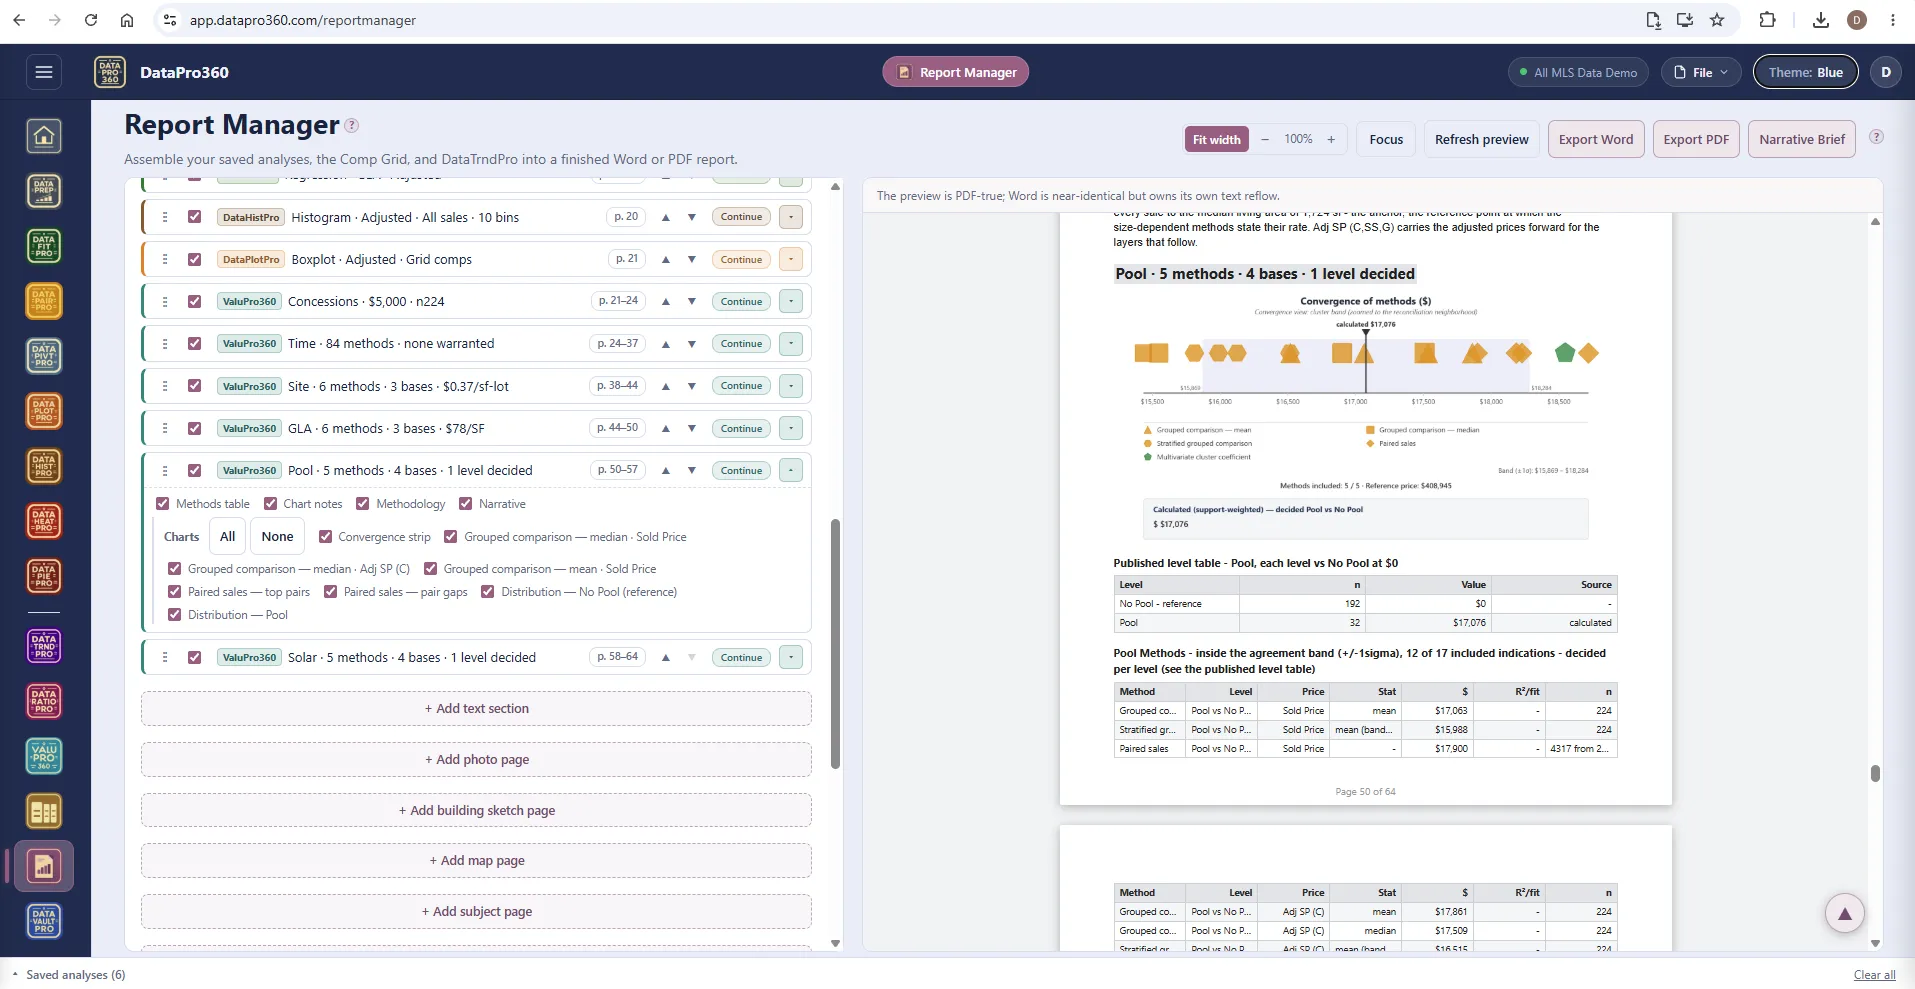
The charts you saved, the charts you print.
Each amenity section lists its charts — the convergence strip, grouped comparisons by median and mean, paired sales, the distributions — and you pick which print. The published level table and the methods table follow the strip on the page.
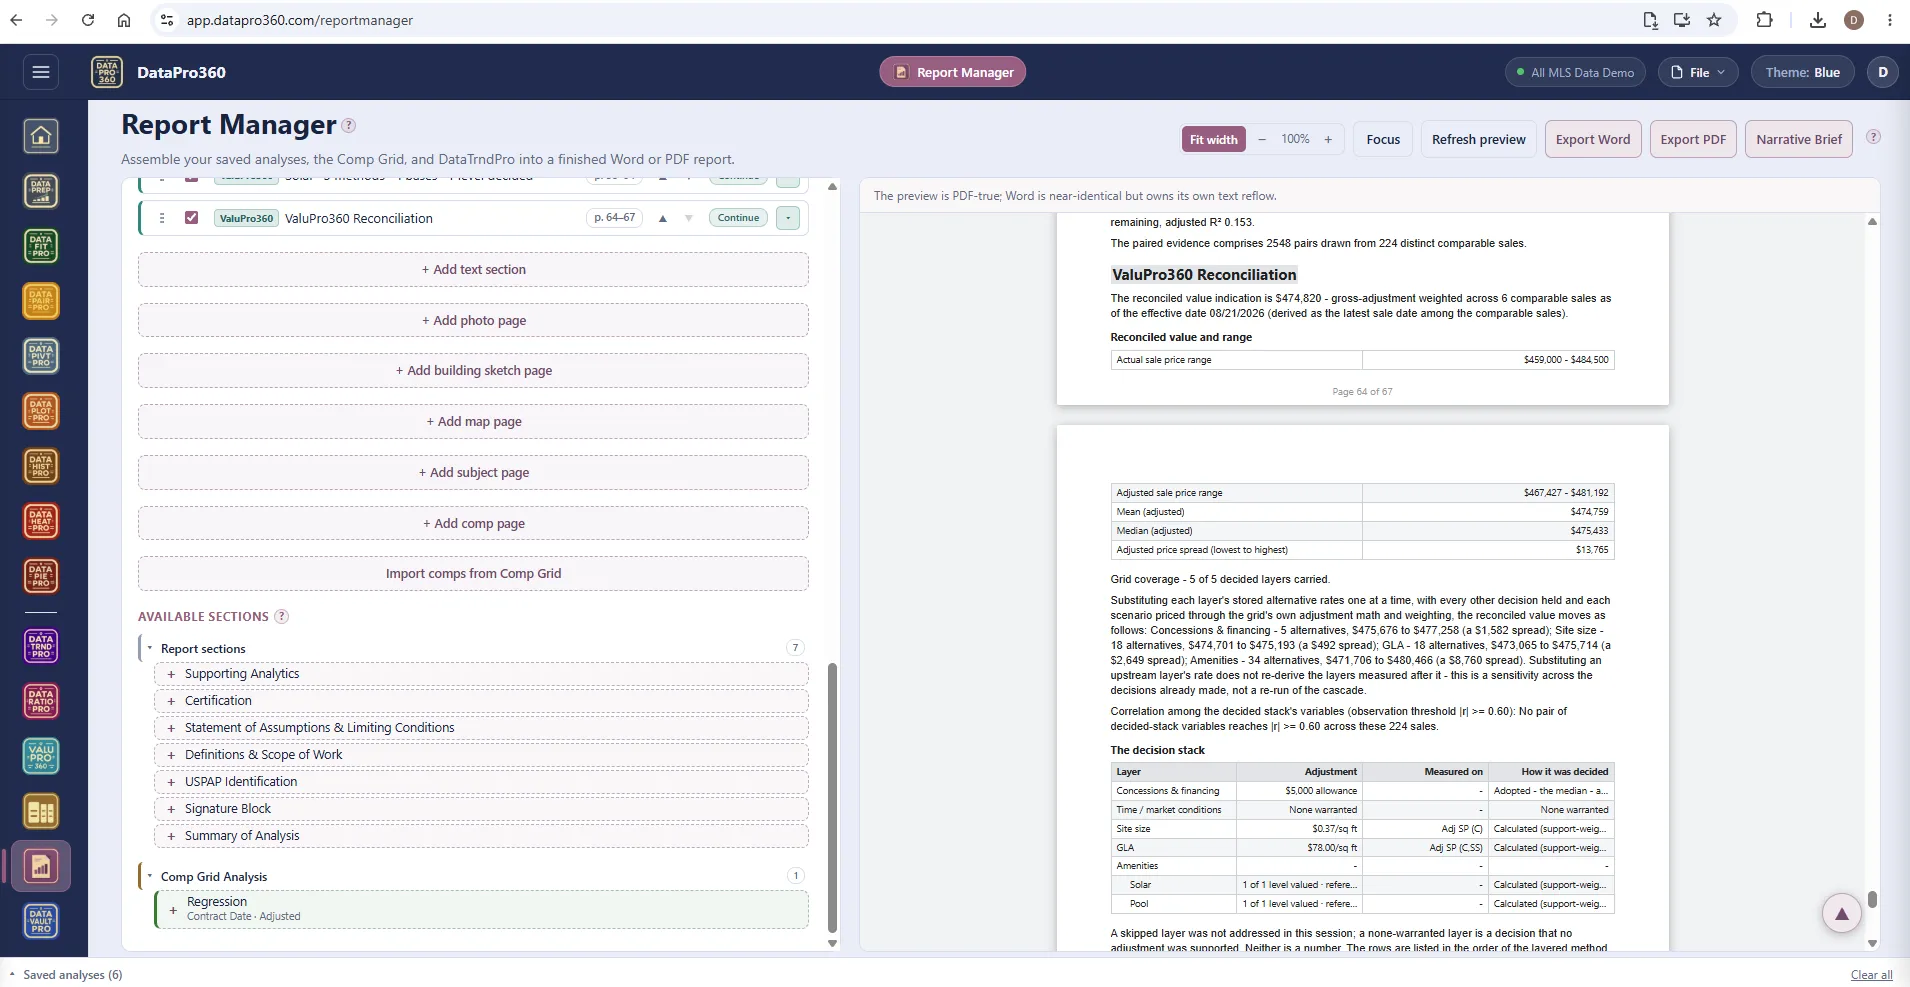
The reconciliation, and the sections still available.
The ValuPro360 Reconciliation section states the reconciled value, the actual and adjusted ranges, the scenario spread with every alternative's cost, the correlation check, and the decision stack layer by layer. Beneath the outline: the report sections not yet added, and the Comp Grid analyses ready to import.
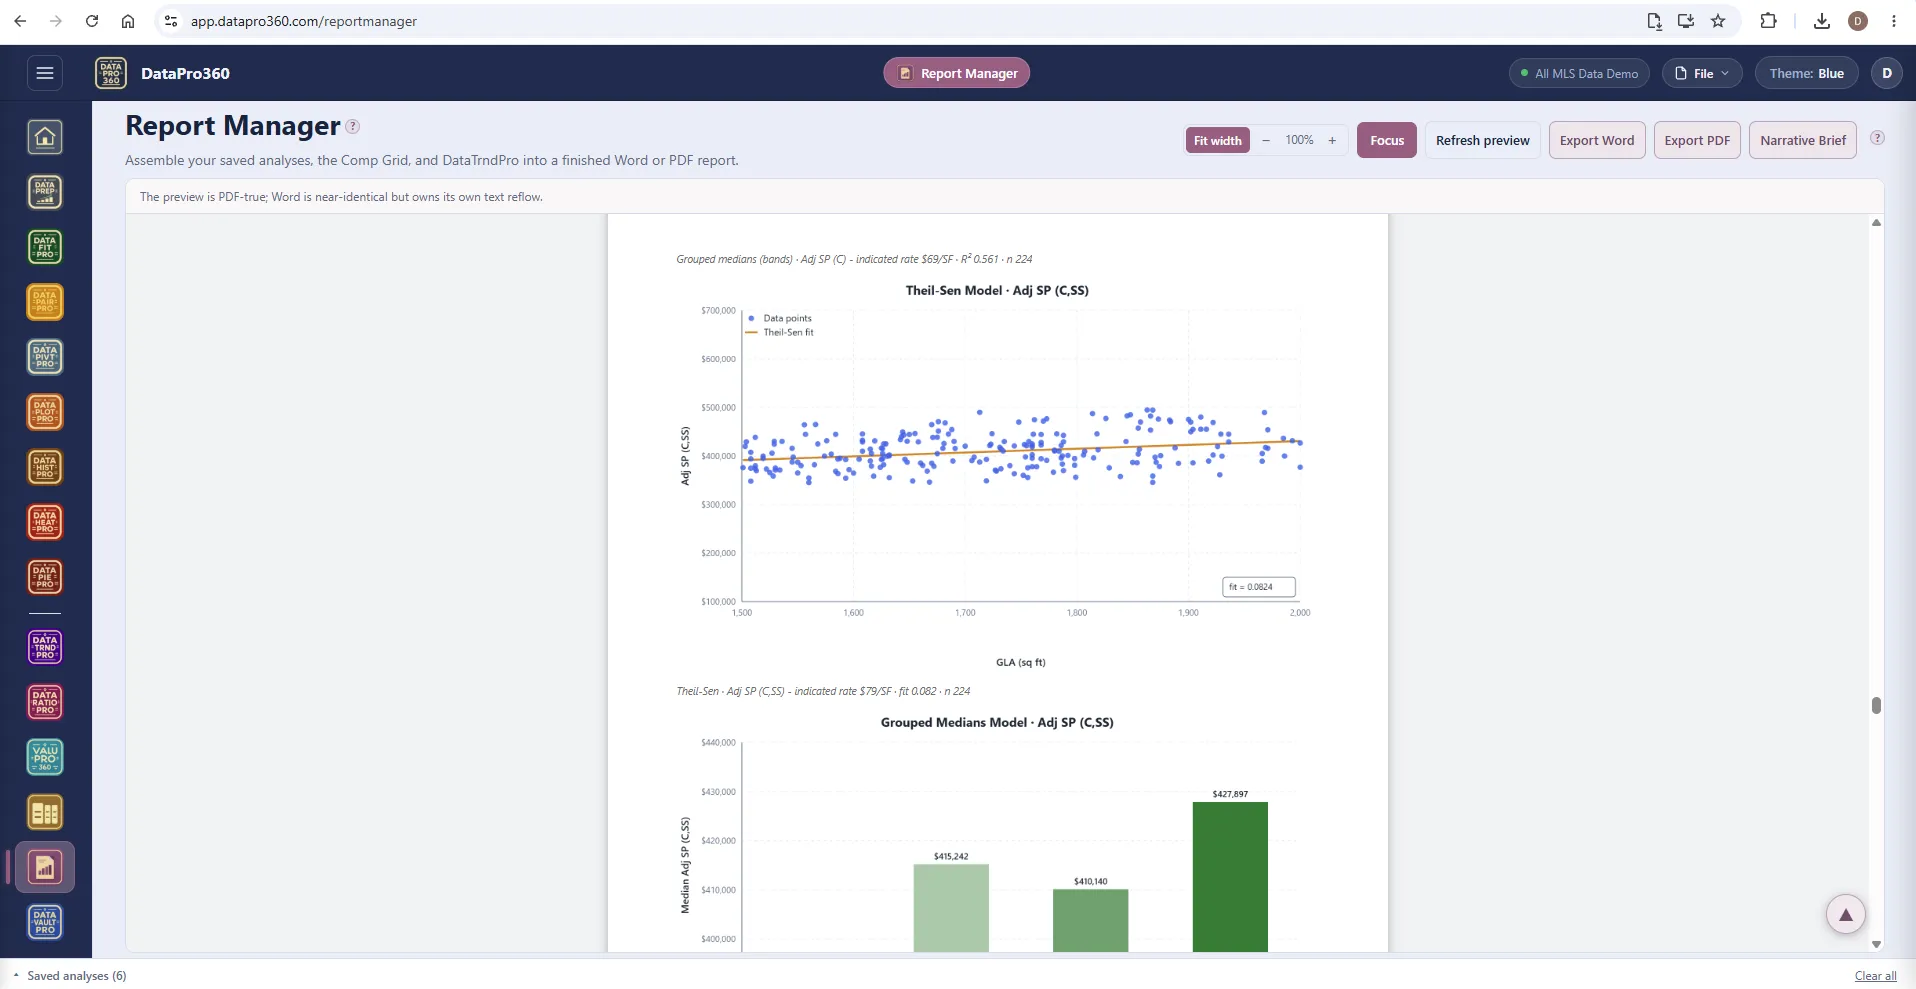
Focus — the report, full width.
Focus hides the outline and gives the preview the window: a Theil-Sen model, a grouped-medians chart, the indicated rate and n stated under each exhibit, exactly as they will print.
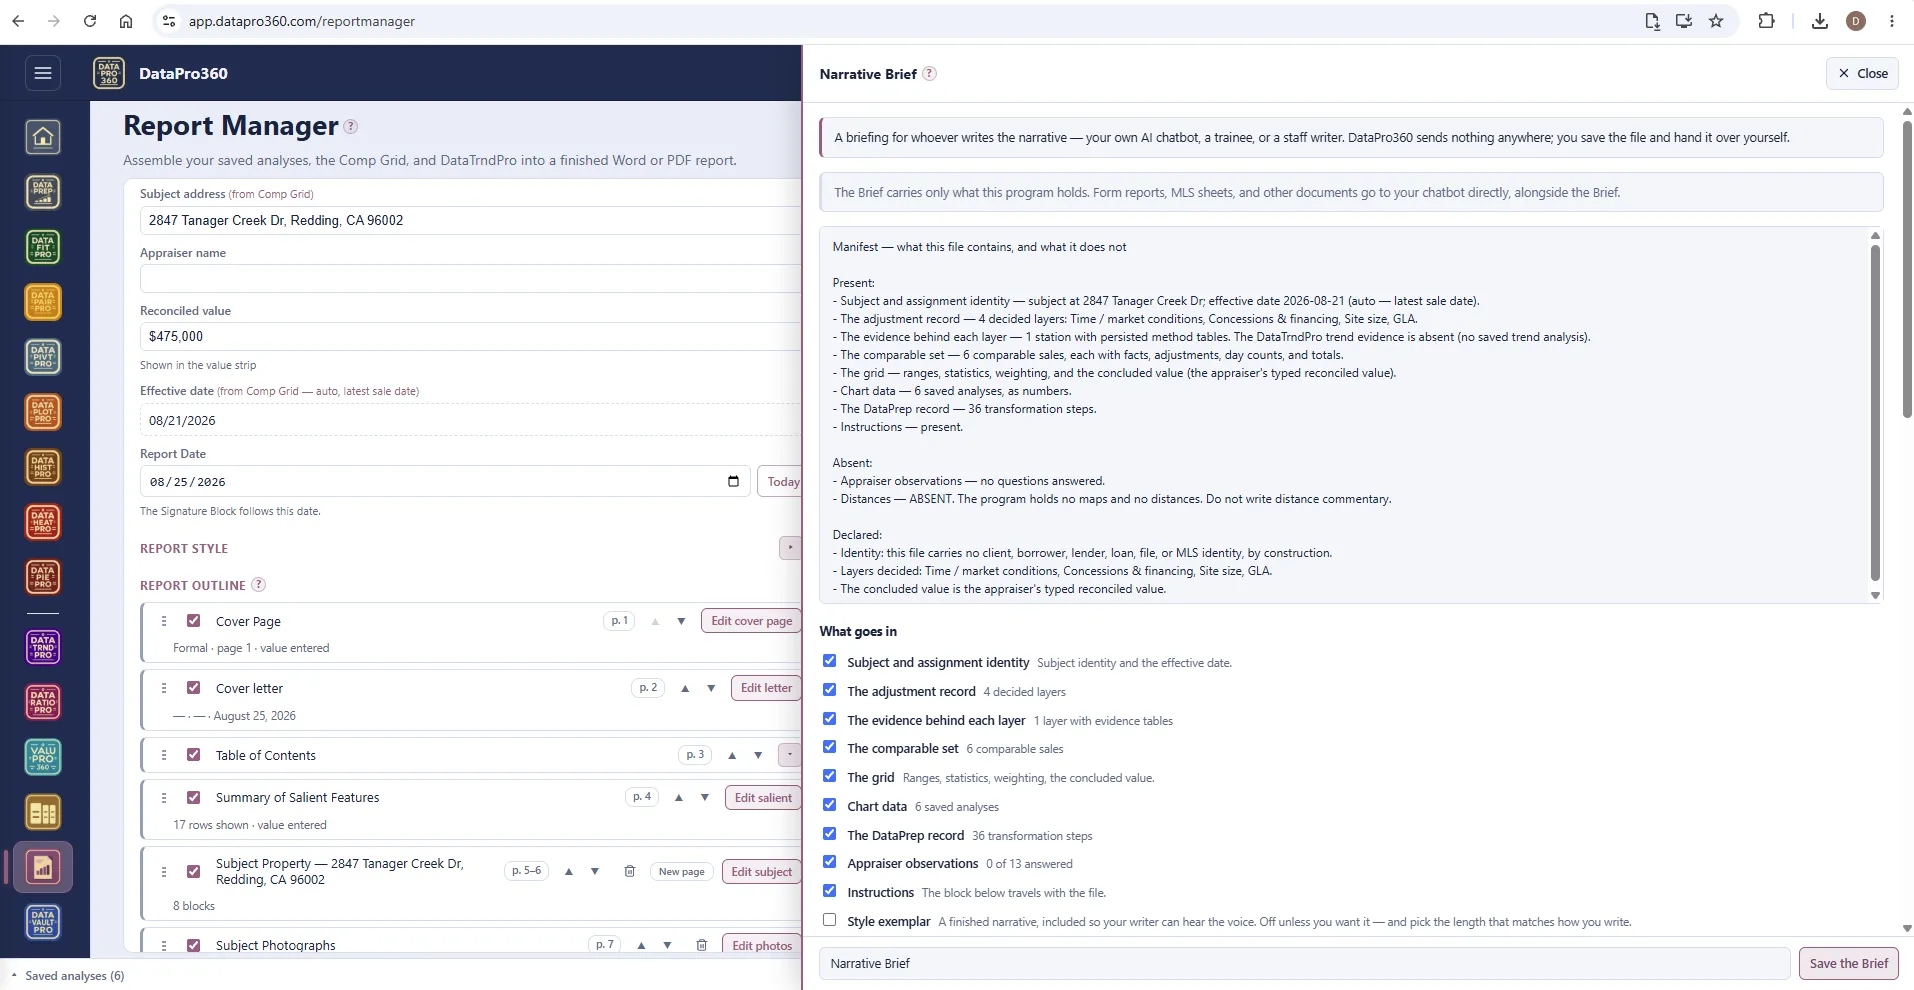
The Narrative Brief — a manifest first.
The Brief opens with what the file contains and what it does not: the subject and effective date, the adjustment record, the evidence behind each layer, the comparable set, the grid, the chart data, the DataPrep record, the instructions. Absent items are declared absent — distances, for one, because the program holds no maps. Identity is stripped by construction.
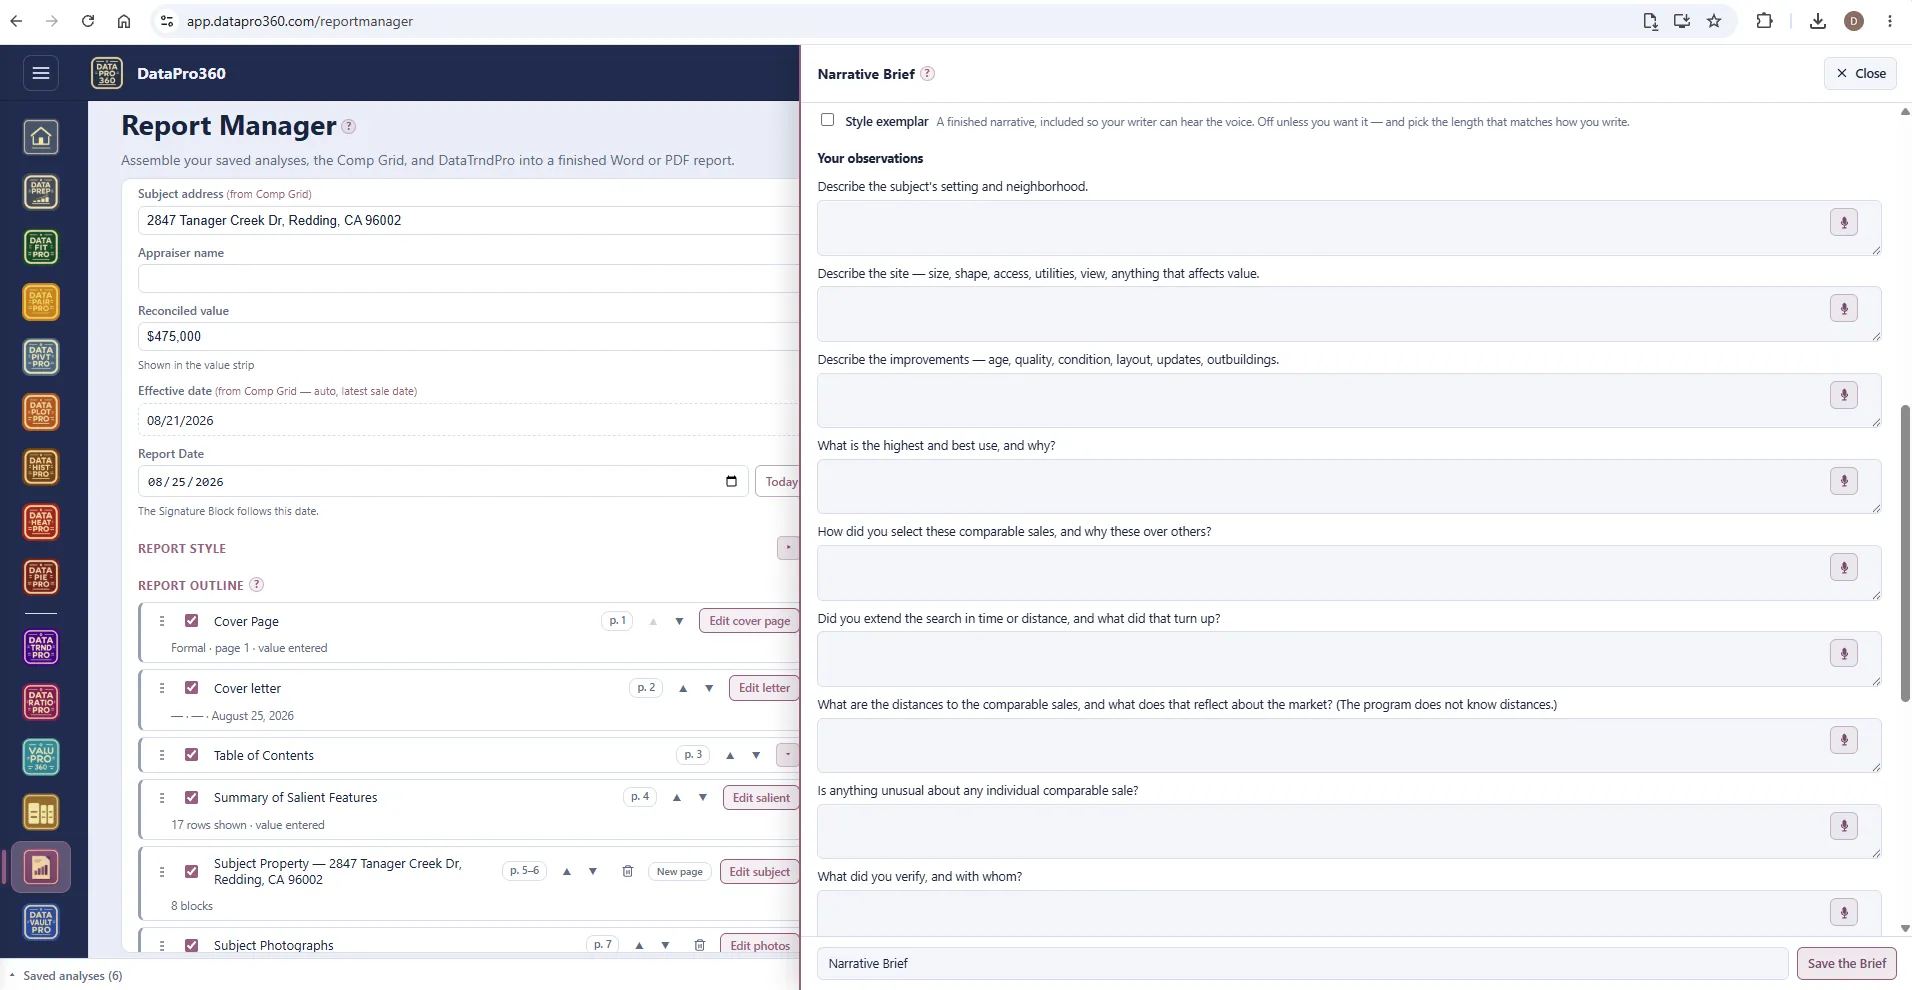
Your observations, in your words.
Thirteen questions the program cannot answer for you — the setting and neighborhood, the site, the improvements, highest and best use, how the comparables were selected, what was verified and with whom — each typed or dictated. What you say travels with the Brief; what you skip is declared unanswered.
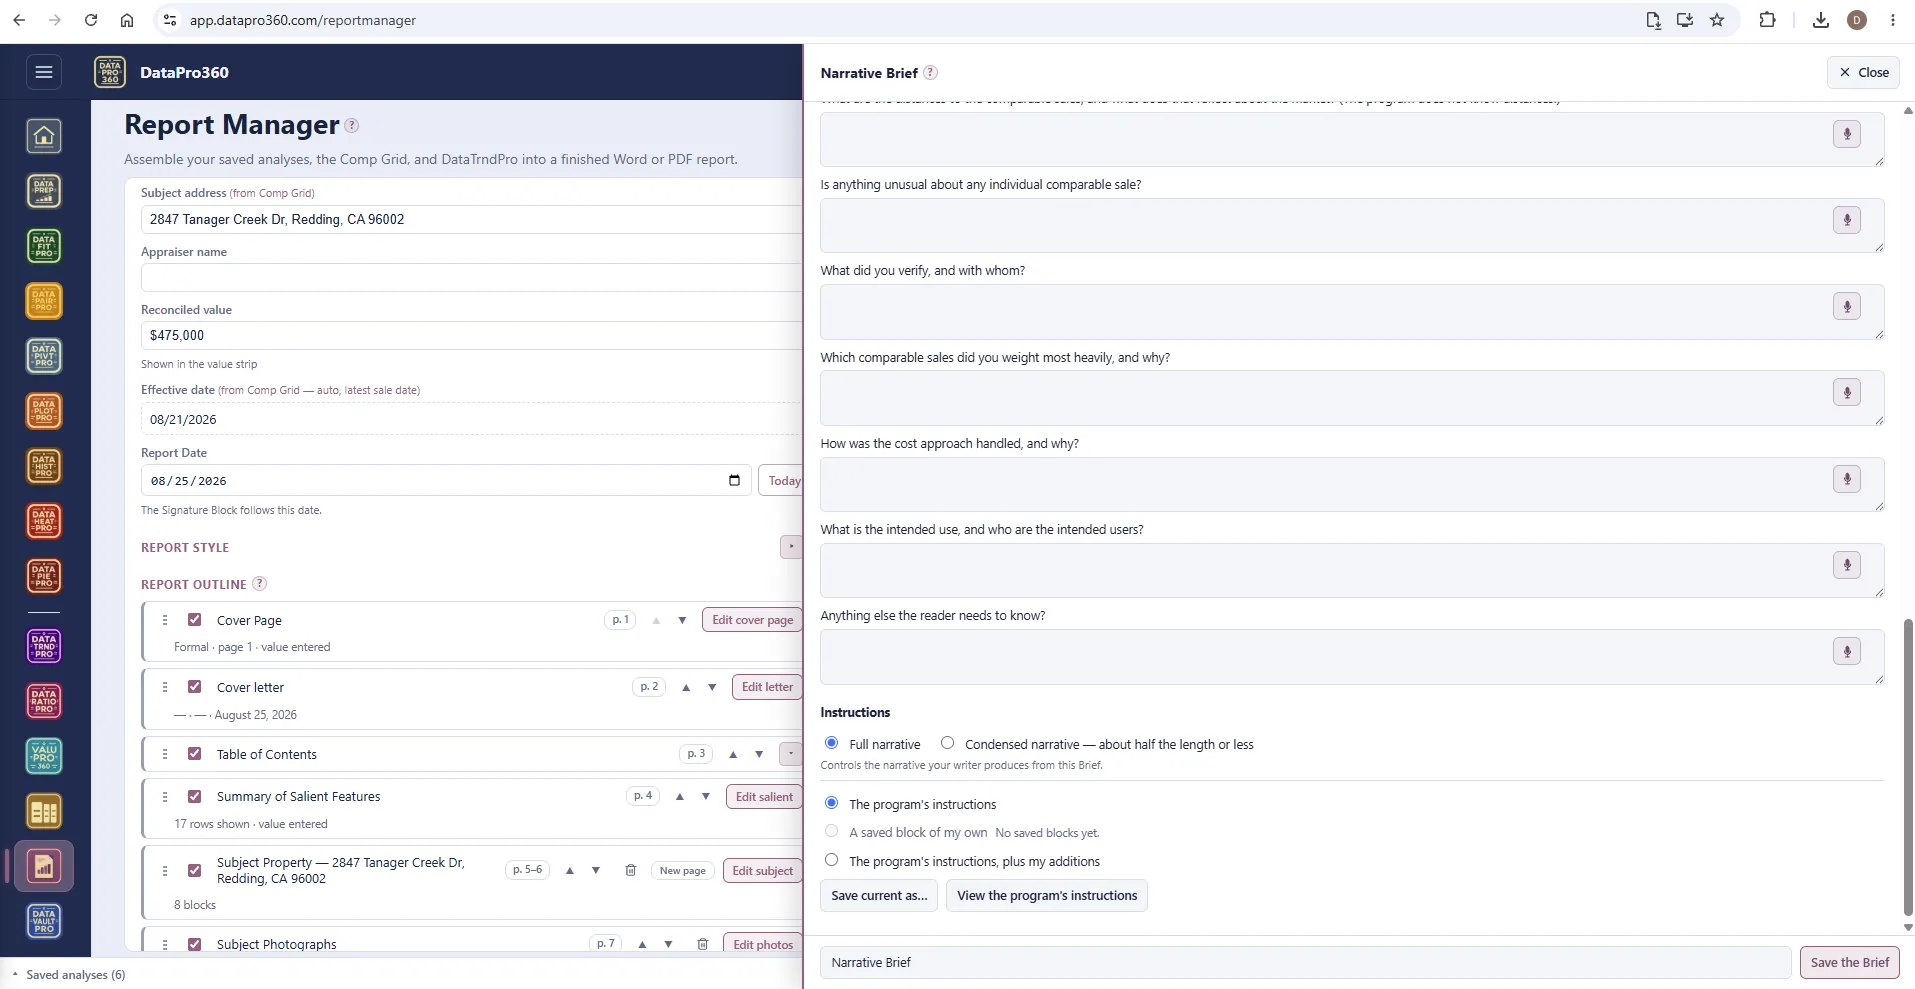
Instructions for the writer.
Full narrative or condensed; the program's instructions, a saved block of your own, or the program's plus your additions. A style exemplar is off unless you want it. Save the Brief and hand it to whoever writes for you.
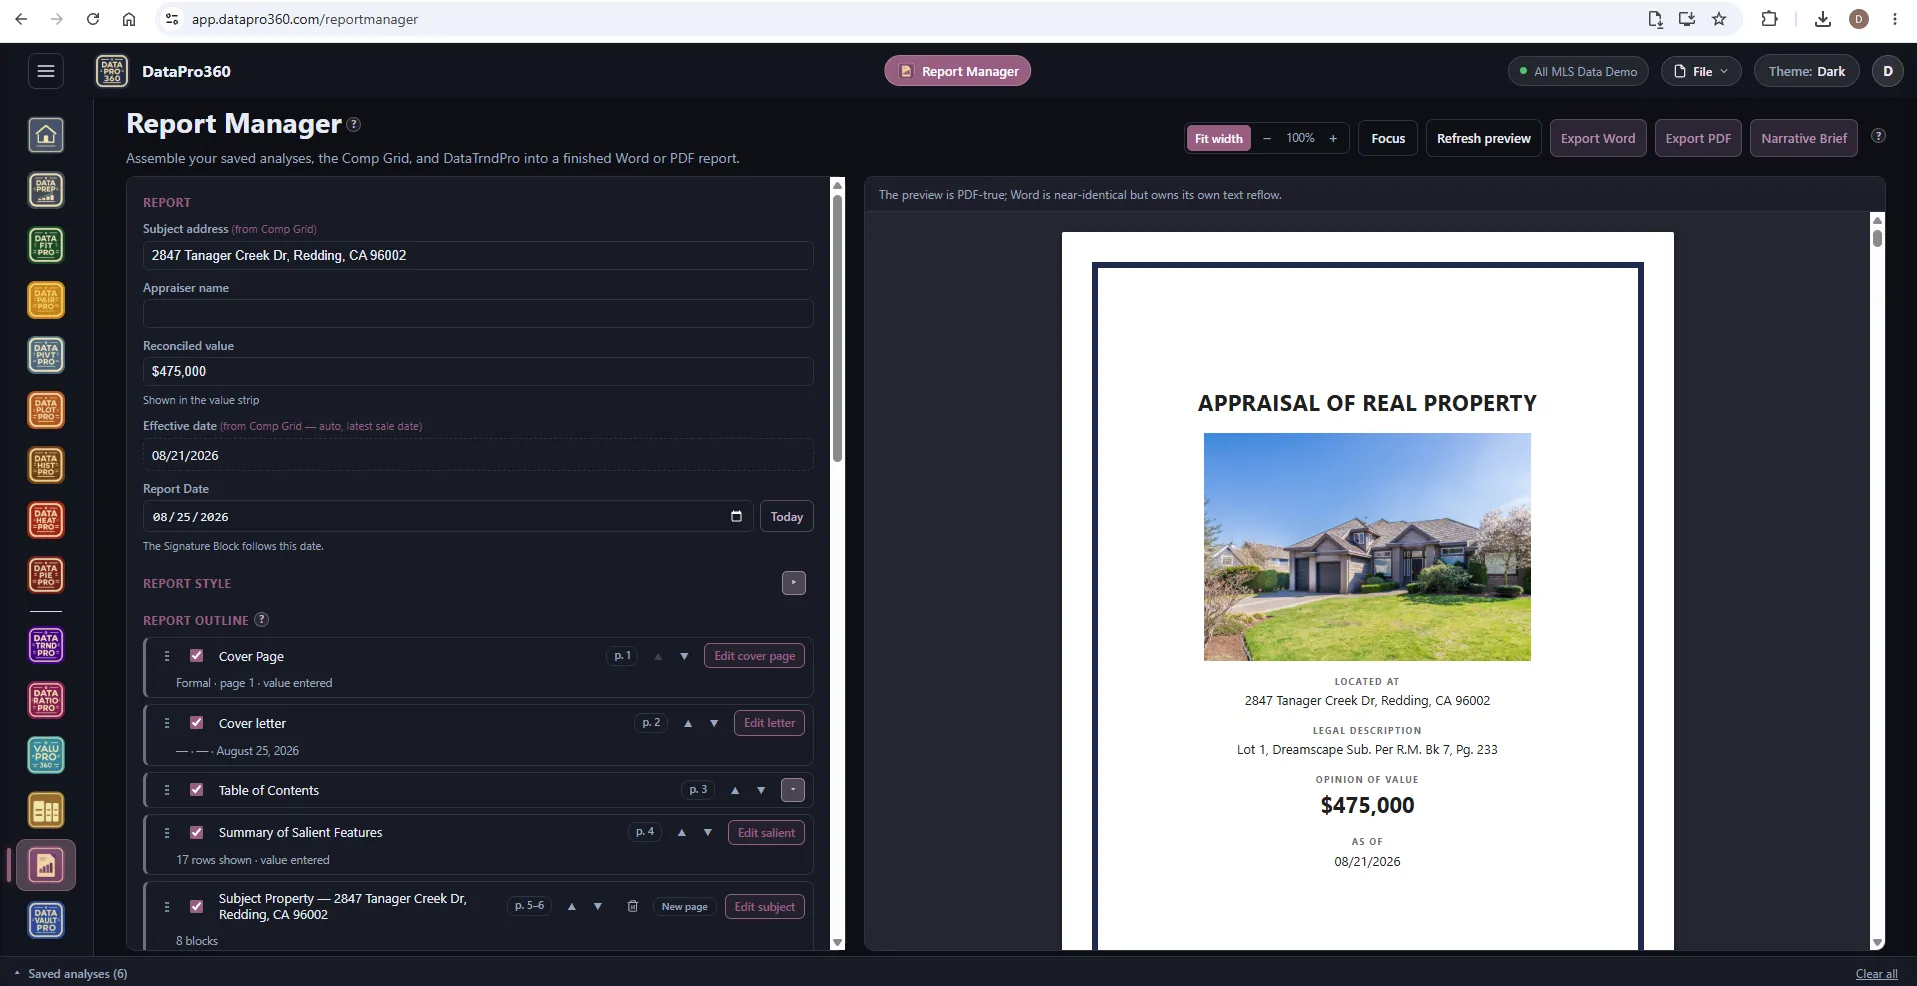
The cover page, in the Dark theme.
Formal cover with the photograph, the address, the legal description, the opinion of value and the effective date — the same page in the dark register.
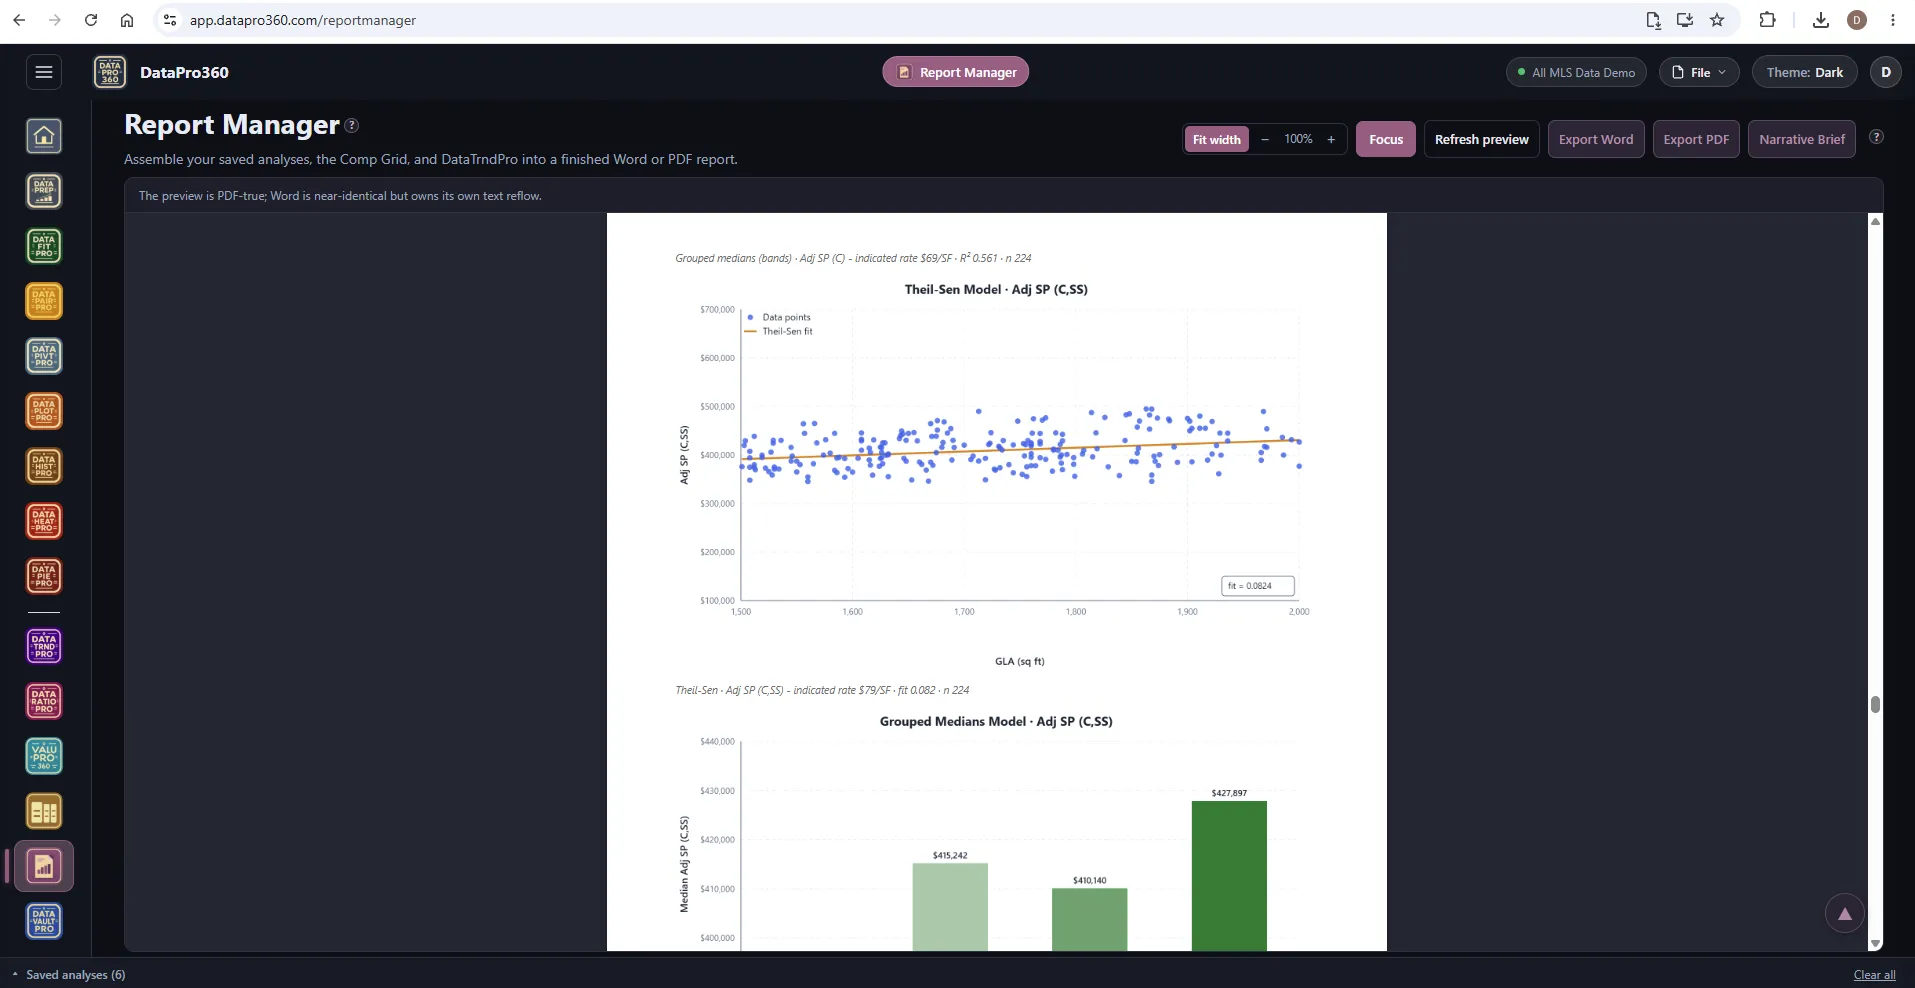
Focus, in the Dark theme.
Charts export as you styled them — the page stays the page whatever the workspace looks like.
Where it sits
In the workflow
Report Manager is the last step: every saved analysis, the Comp Grid's reconciliation and adjustment summary, and the DataTrndPro run arrive as sections, and the finished Word or PDF report goes out the other end.
See the whole workflow → Comp Grid
 ValuPro360
 DataTrndPro
After
The finished Word or PDF report.
Hand the reviewer the finished report.
Every chart, every method, every decision — assembled once, kept current as the work moves, exported when it is done.
$69.95 per user, per month. 30-day free trial, no credit card required. No long-term contract.