Support
Built like a training ground.
Not a help desk bolted on afterward — a body of teaching written into the program, behind every ? on every screen, from your first twenty minutes to the questions a review appraiser will ask.
- 500+
- help entries, written to teach
- 52
- areas — every surface, every station
- 119
- glossary terms with worked examples
- ?
- on every screen — the answer is where the question is
Where to start
Your first twenty minutes.
- Home, then the file picker. Excel or CSV.
- DataPrep, then Map Fields. Confirm sale price, the dates, living area and site size.
- DataHistPro on sale price — one market or two, and where the middle is.
- ValuPro360: Concessions, Time, Site Size, GLA, Amenities. Save each analysis when you decide it.
- Comp Grid: the adjustments are already there. Subject facts, comparables, weights, conclusion.
- Report Manager: order the sections, add what the assignment needs, export.
Help behind the ? on every screen.
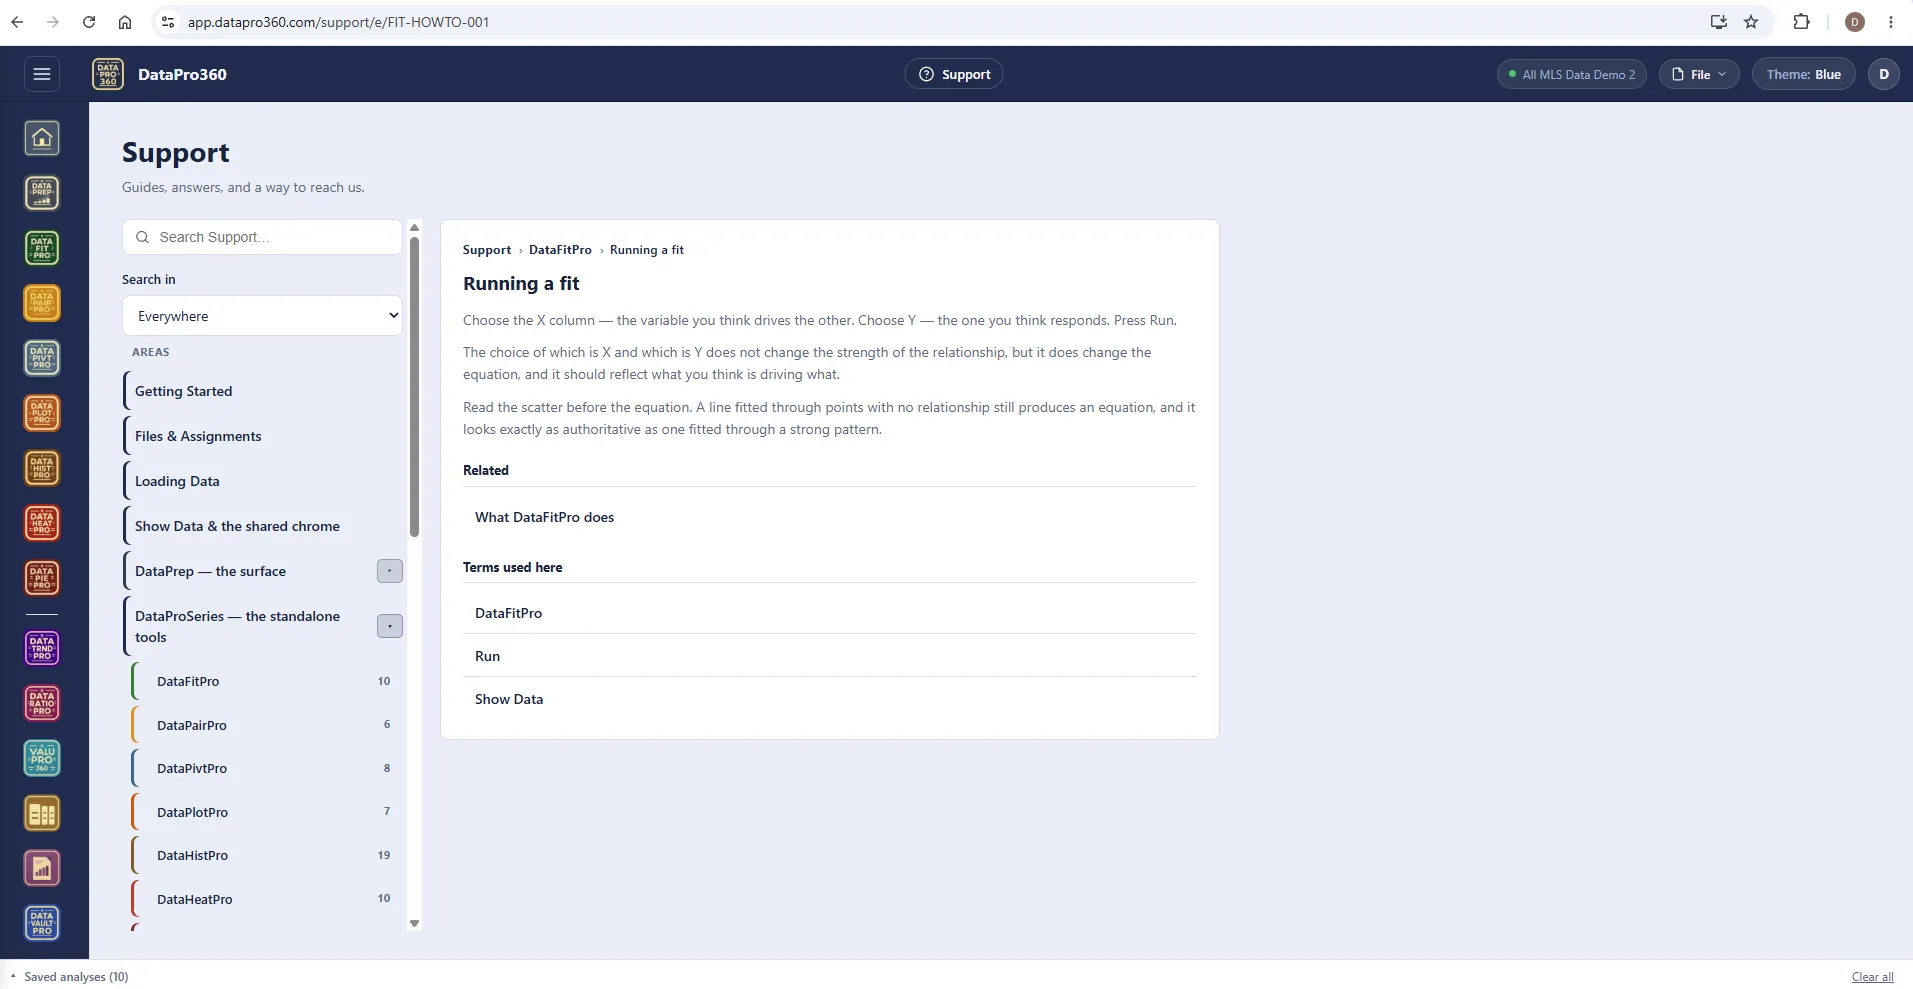
Every control, every panel and every station carries a small ? that opens the entry for it — what the control does, what to read before the number, what a reviewer will ask. Search matches titles, keywords and terms across the whole program, or narrow it to one area. Hide the buttons once you know your way around; Support stays in the menu.
The ValuPro360 walk, station by station.
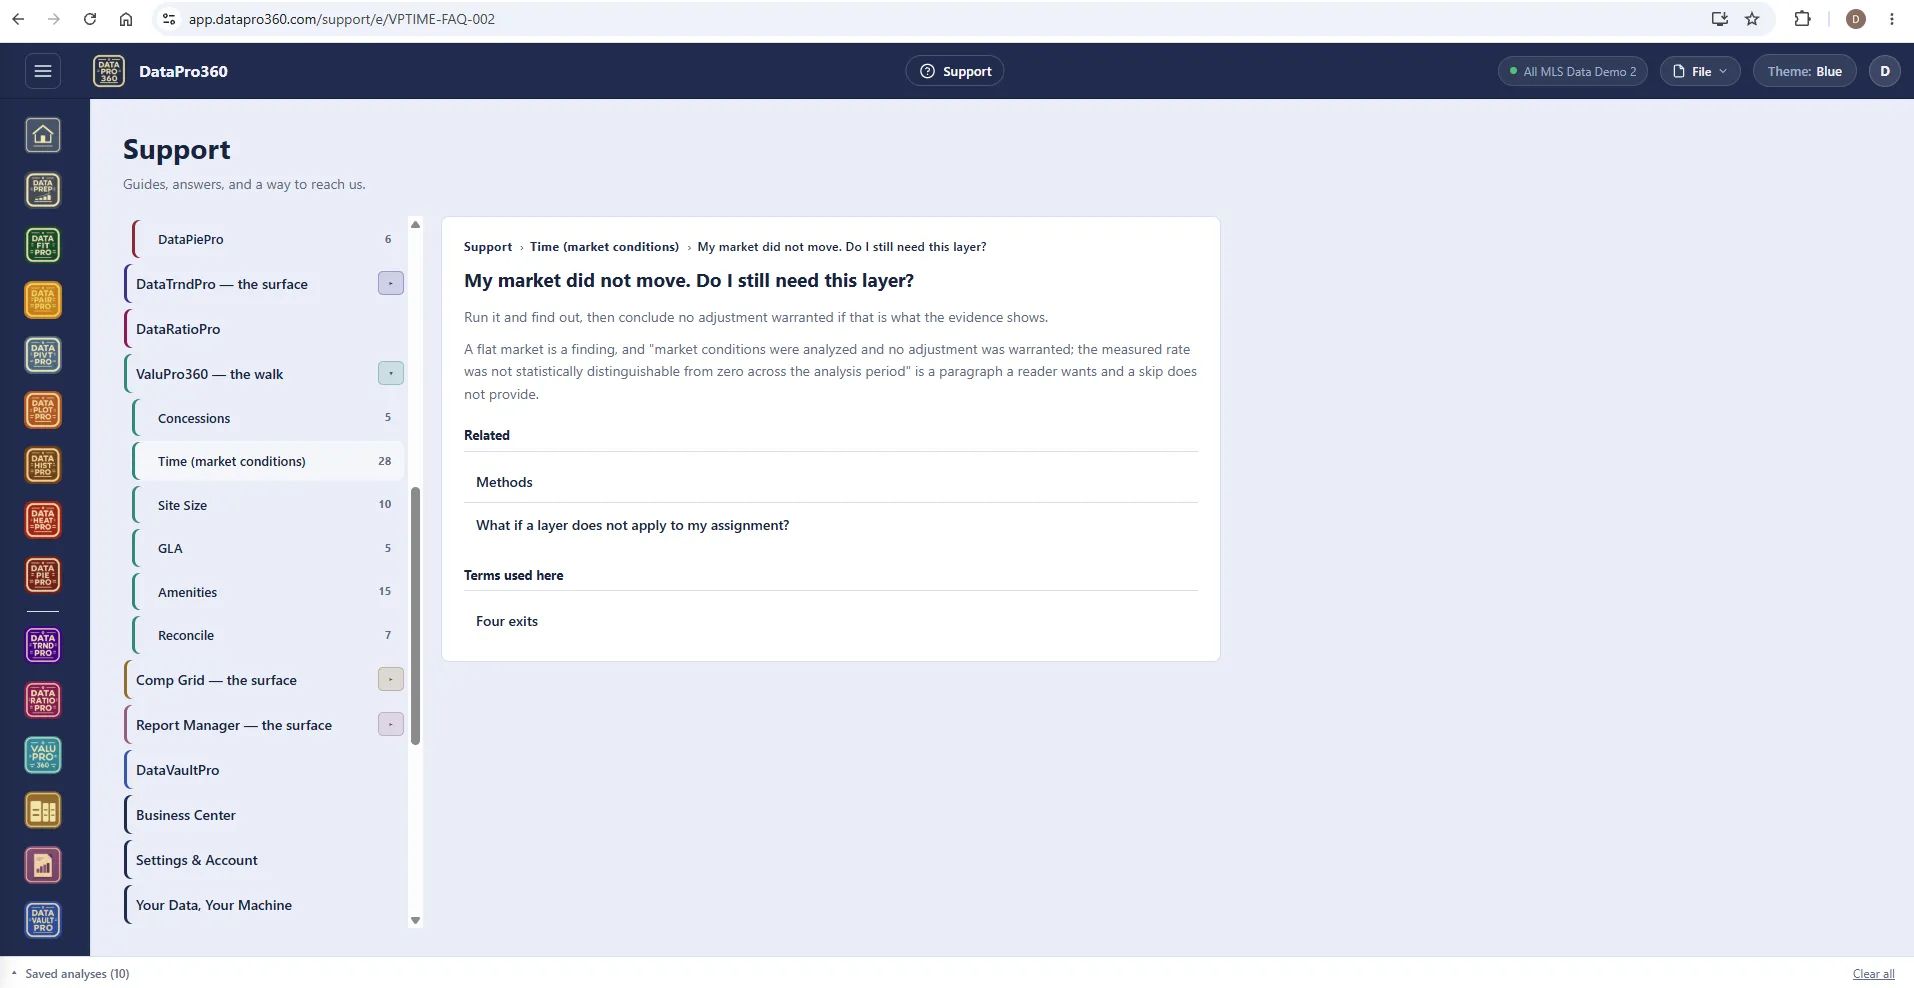
Concessions, Time, Site Size, GLA, Amenities, Reconcile — each with its own area: what the station measures, the methods, reading the table, deciding when methods disagree, and the questions that come up on real files. "My market did not move. Do I still need this layer?" has an answer: run it and find out, then conclude no adjustment warranted if that is what the evidence shows.
What a reviewer will ask — and what if you disagree.
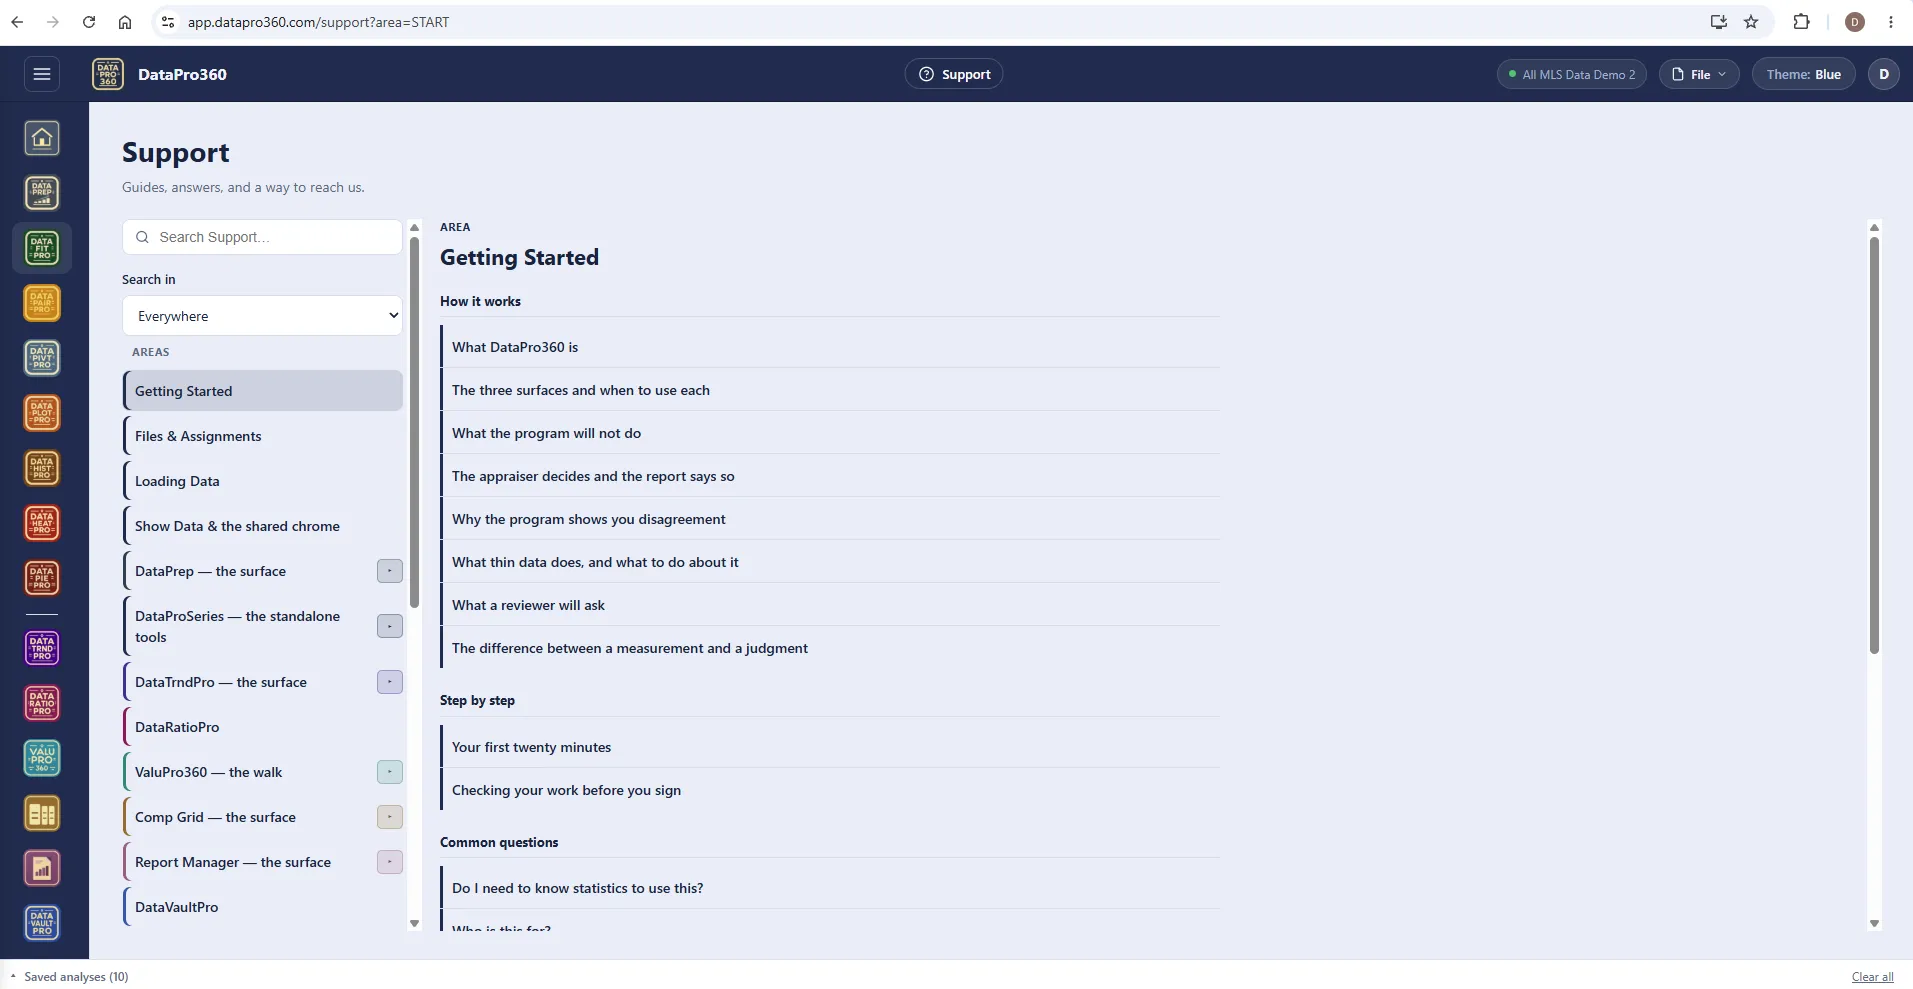
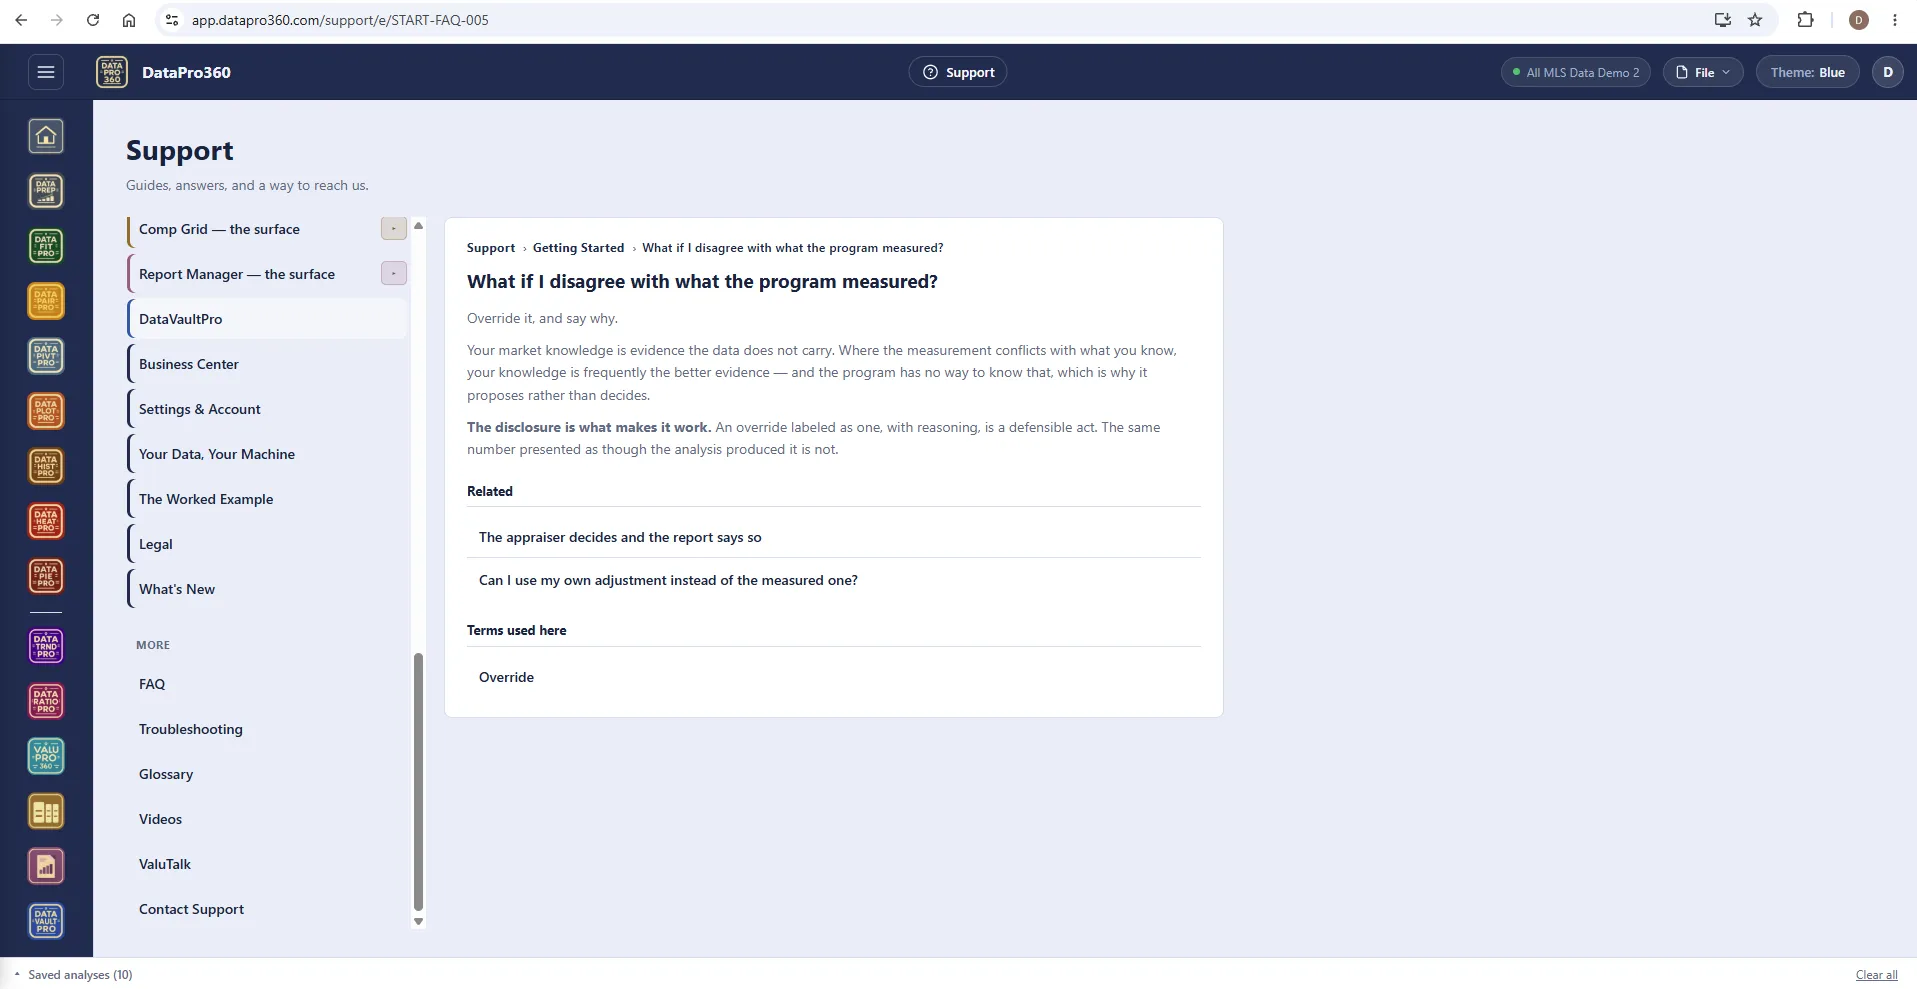
Getting Started leads with the questions that matter before the first file: what the program will not do, the difference between a measurement and a judgment, why the program shows you disagreement, what thin data does. And when your market knowledge conflicts with what the program measured: override it, and say why. An override labeled as one, with reasoning, is a defensible act.
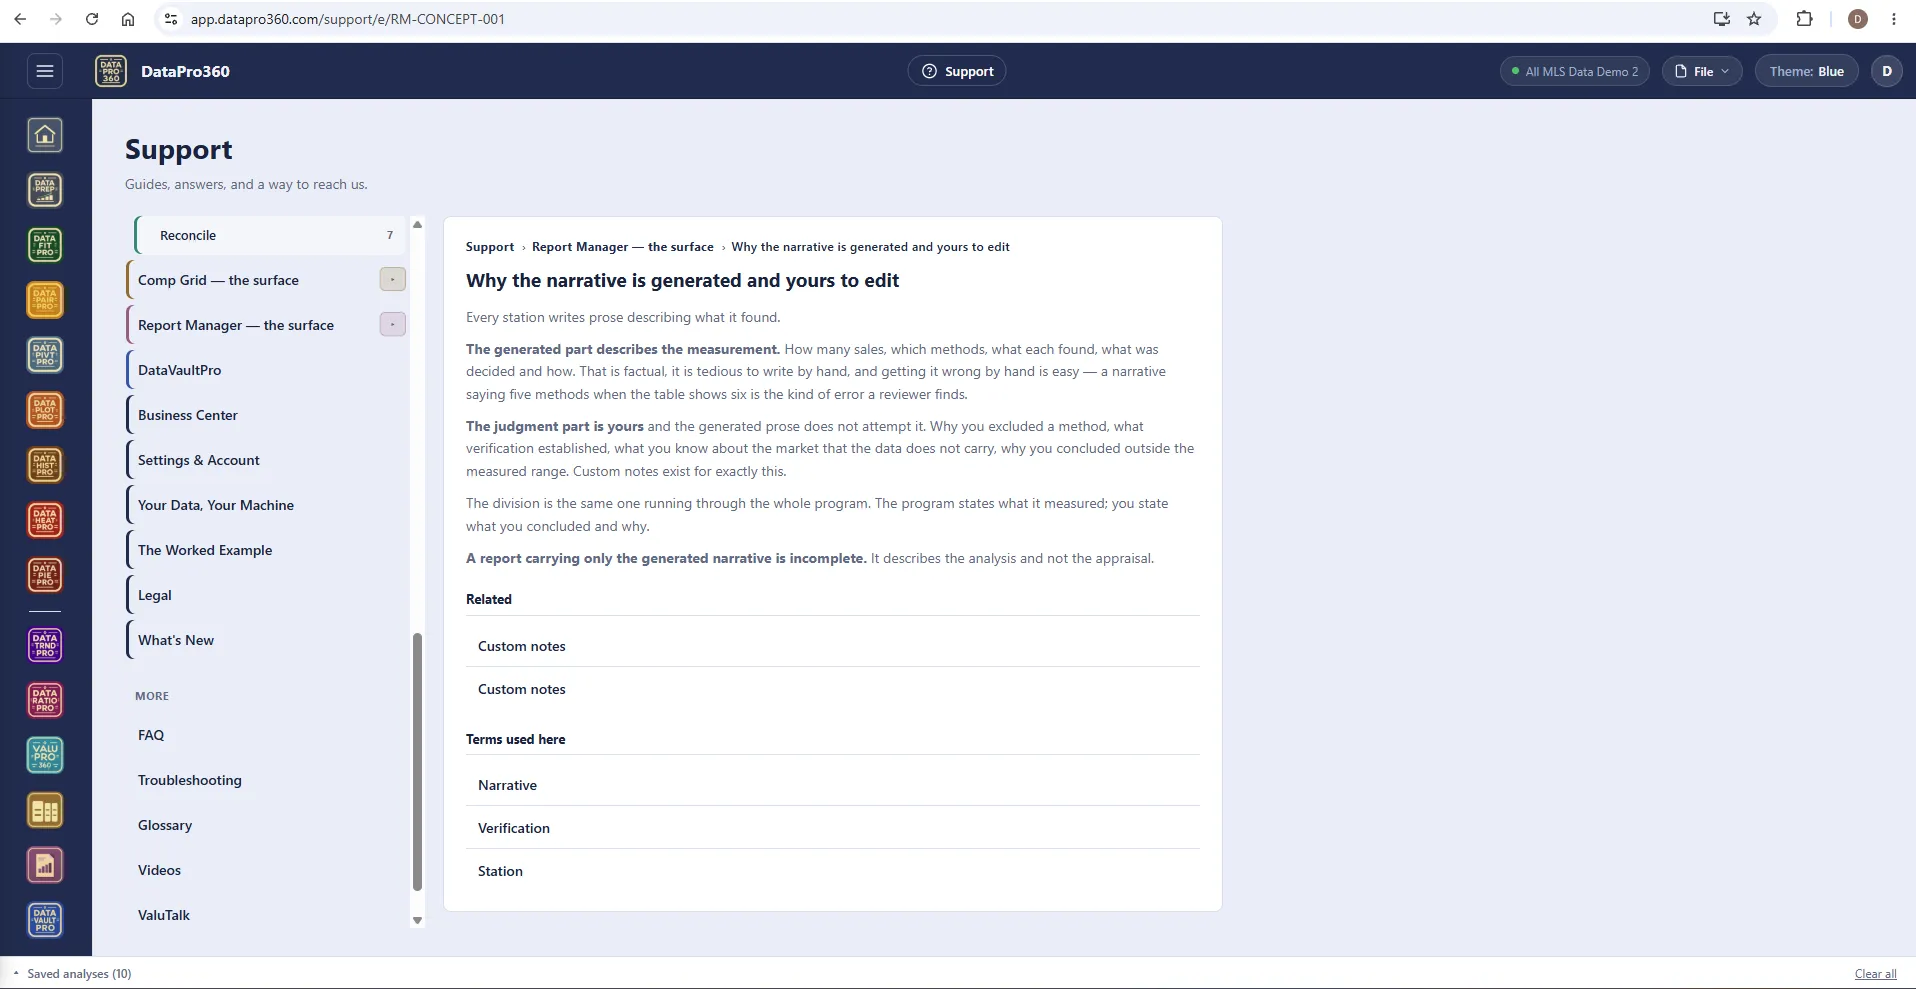
Why the narrative is generated and yours to edit.
The generated part describes the measurement — how many sales, which methods, what each found, what was decided and how. The judgment part is yours, and the generated prose does not attempt it. The same division runs through the whole program: the program states what it measured; you state what you concluded and why. A report carrying only the generated narrative is incomplete, and Support says so.
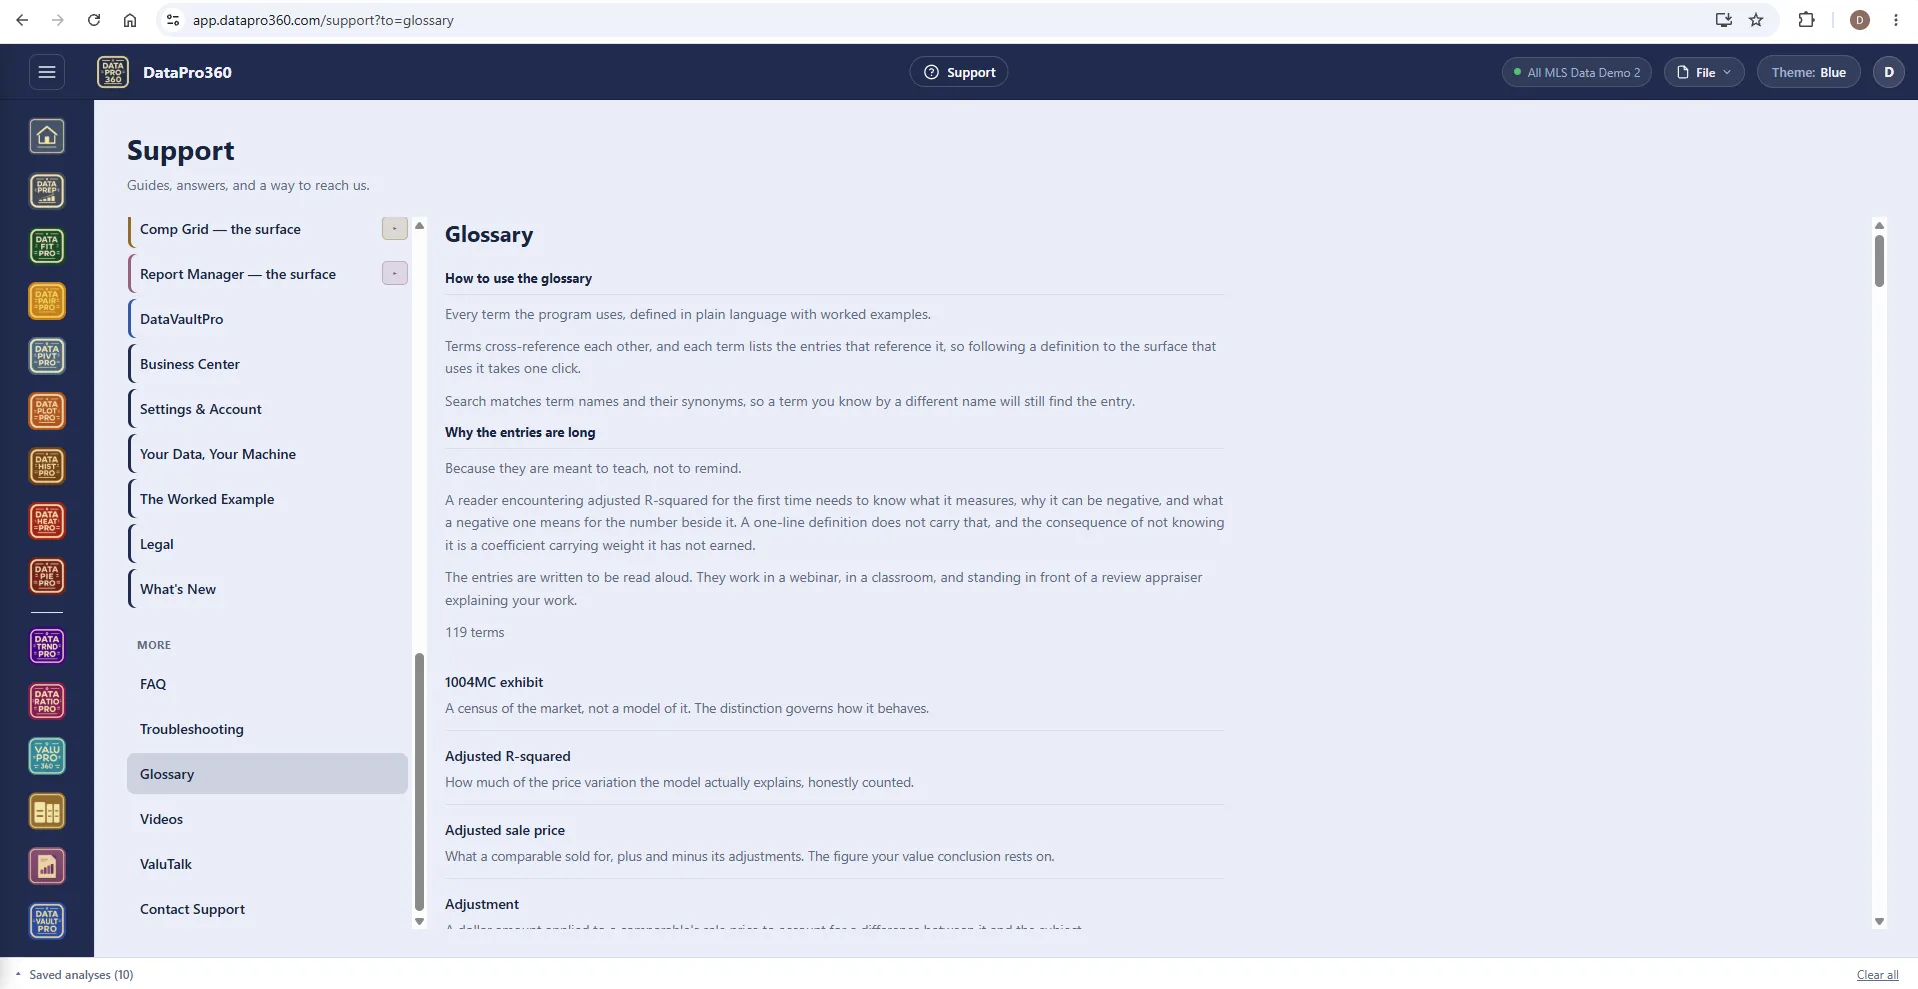
A glossary written to teach, not to remind.
Every term the program uses, defined in plain language with worked examples — 119 of them. Terms cross-reference each other and each lists the entries that use it. The entries are long on purpose: a reader meeting adjusted R-squared for the first time needs to know what it measures, why it can be negative, and what a negative one means for the number beside it. They are written to be read aloud — in a webinar, in a classroom, and standing in front of a review appraiser explaining your work.
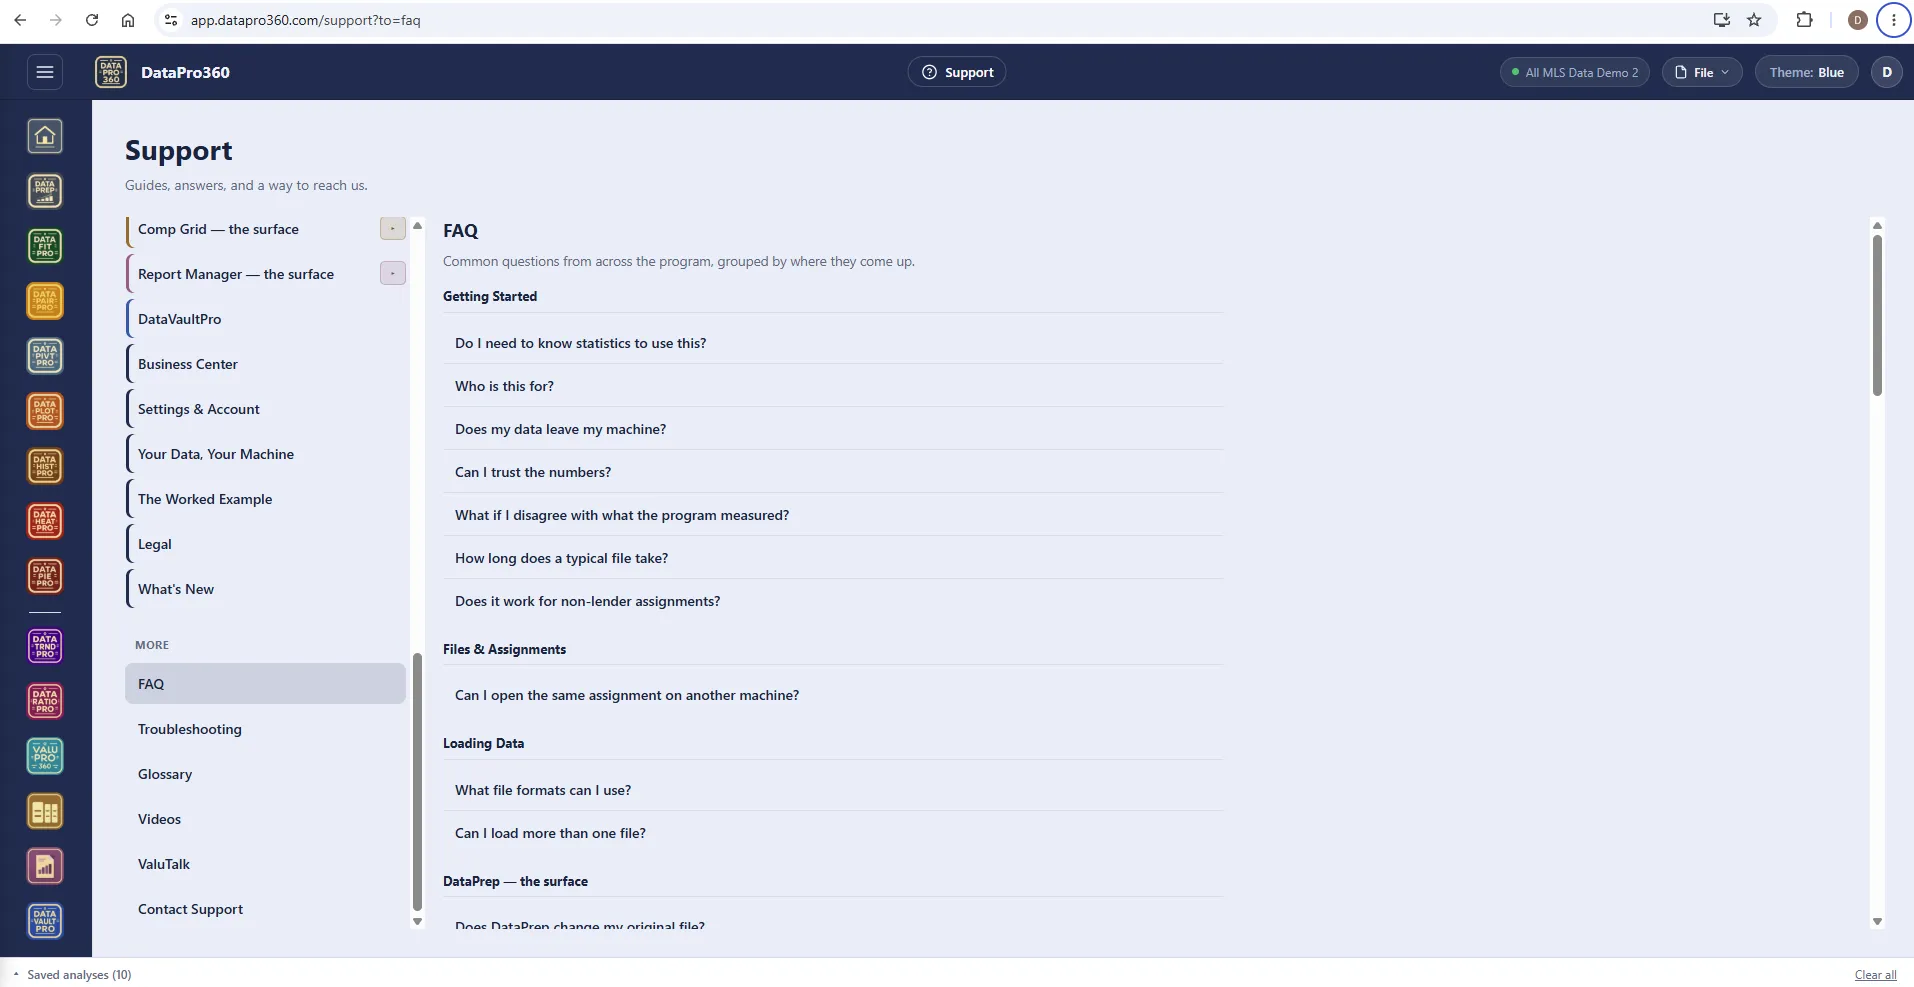
The FAQ, grouped by where the question comes up.
Do I need to know statistics to use this? Who is this for? Does my data leave my machine? Can I trust the numbers? How long does a typical file take? Does it work for non-lender assignments? Common questions from across the program, each answered in the area it belongs to, with troubleshooting entries titled by the exact message the screen shows.
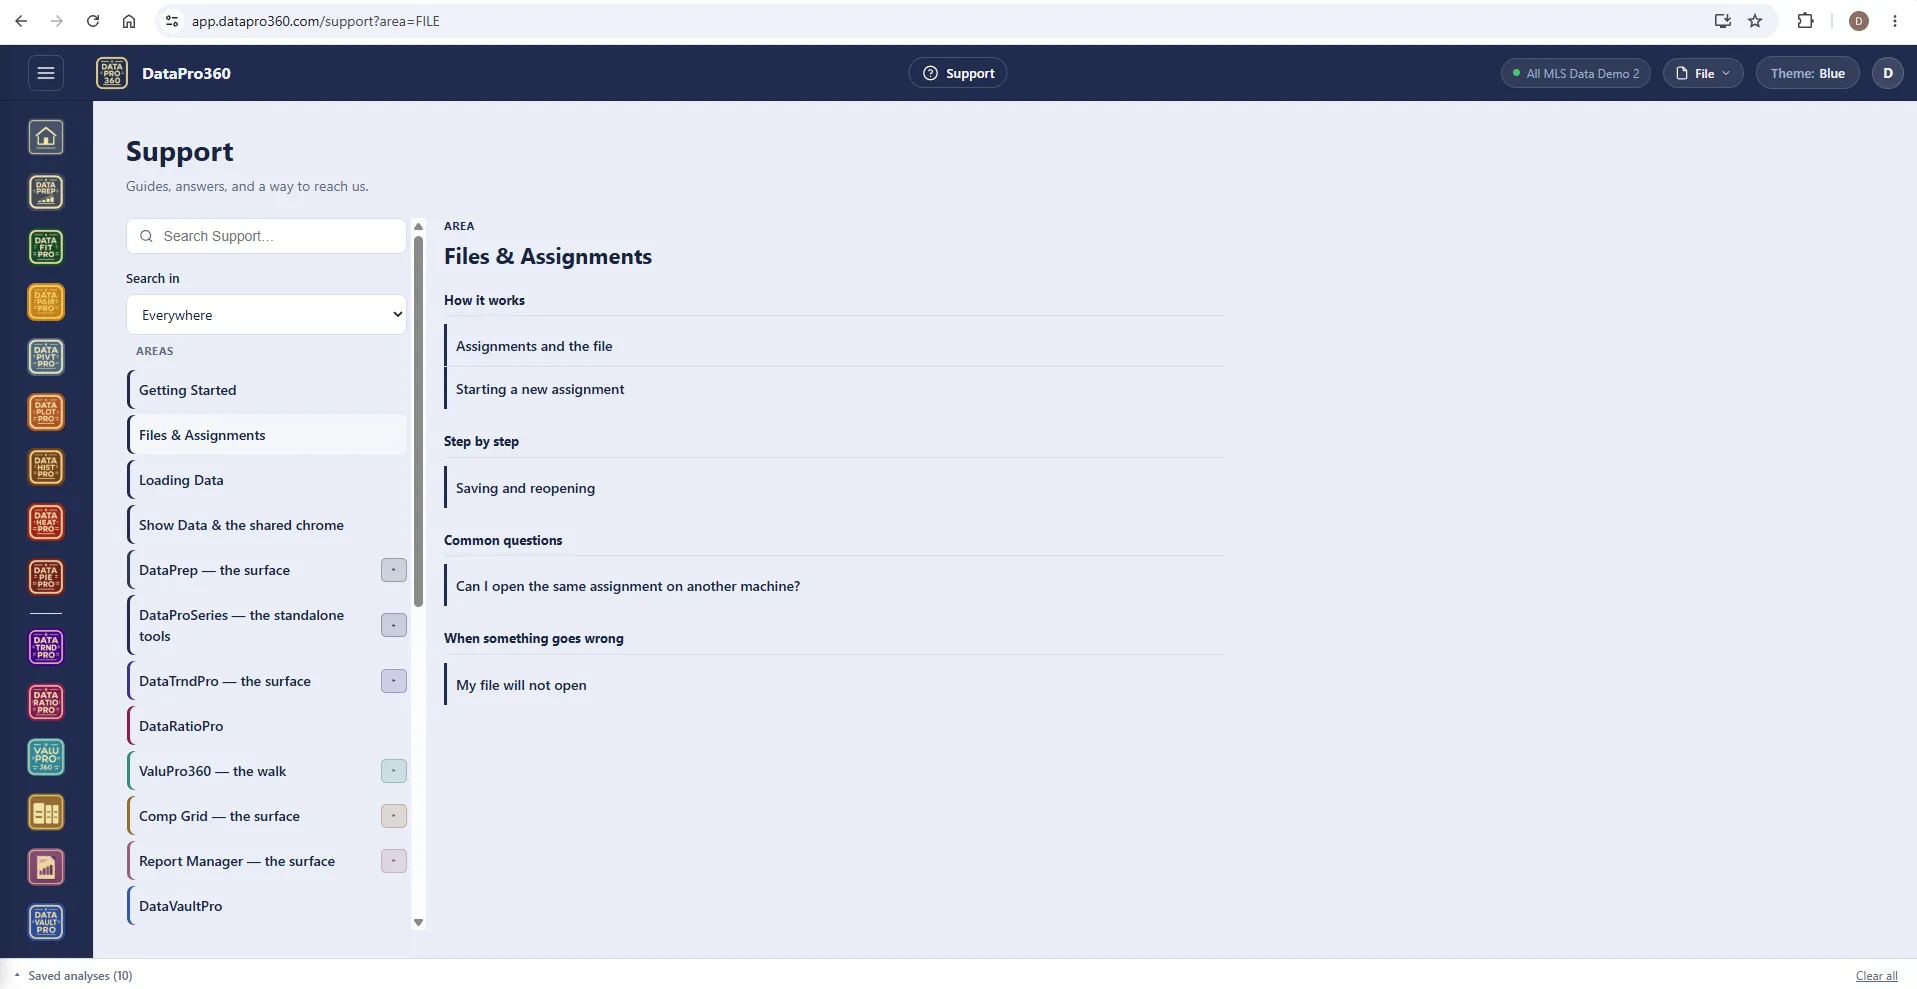
Files, assignments, and the machine your work lives on.
How an assignment and its .dp360 file relate, saving and reopening, opening the same assignment on another machine, what to do when a file will not open. And an area called Your Data, Your Machine: where your data is processed, what is processed where, whether you need to be online, and what your data is not used for.
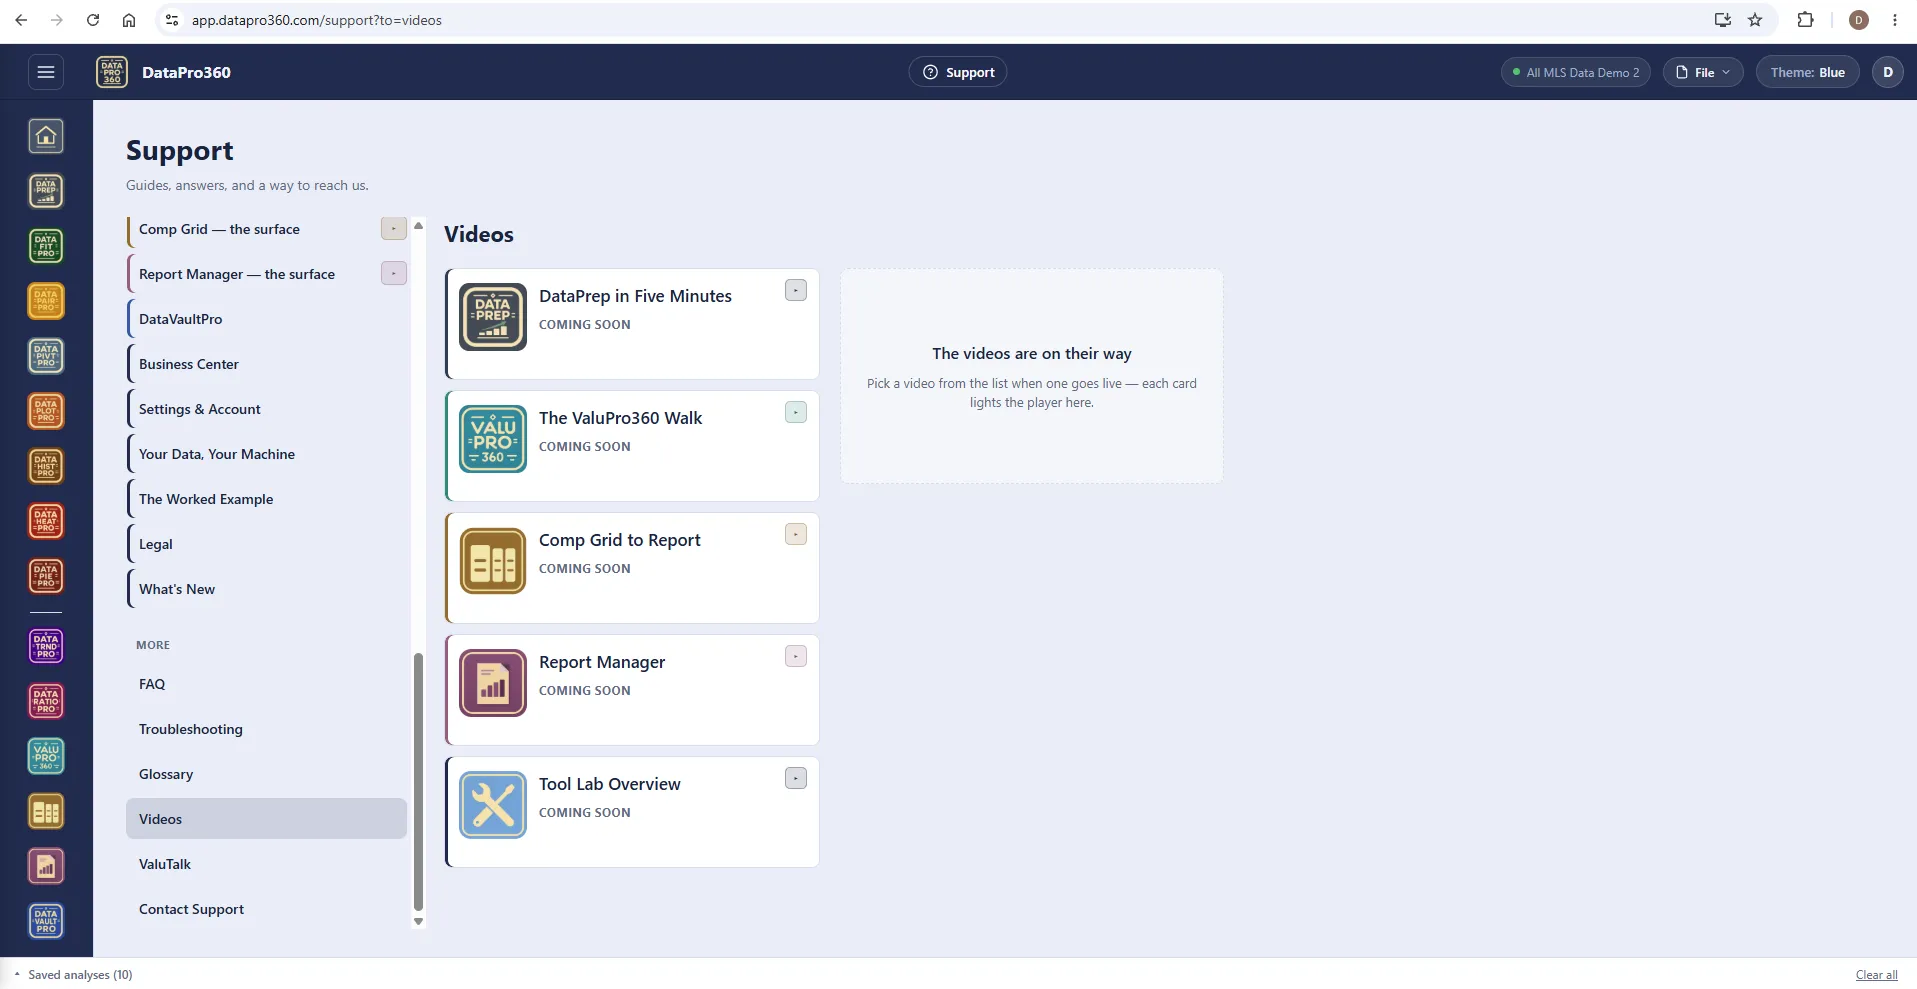
Videos — on their way.
DataPrep in Five Minutes, The ValuPro360 Walk, Comp Grid to Report, Report Manager, Tool Lab Overview. The cards are in place; each lights the player when its video goes live. Until then, the written walks carry the same ground.
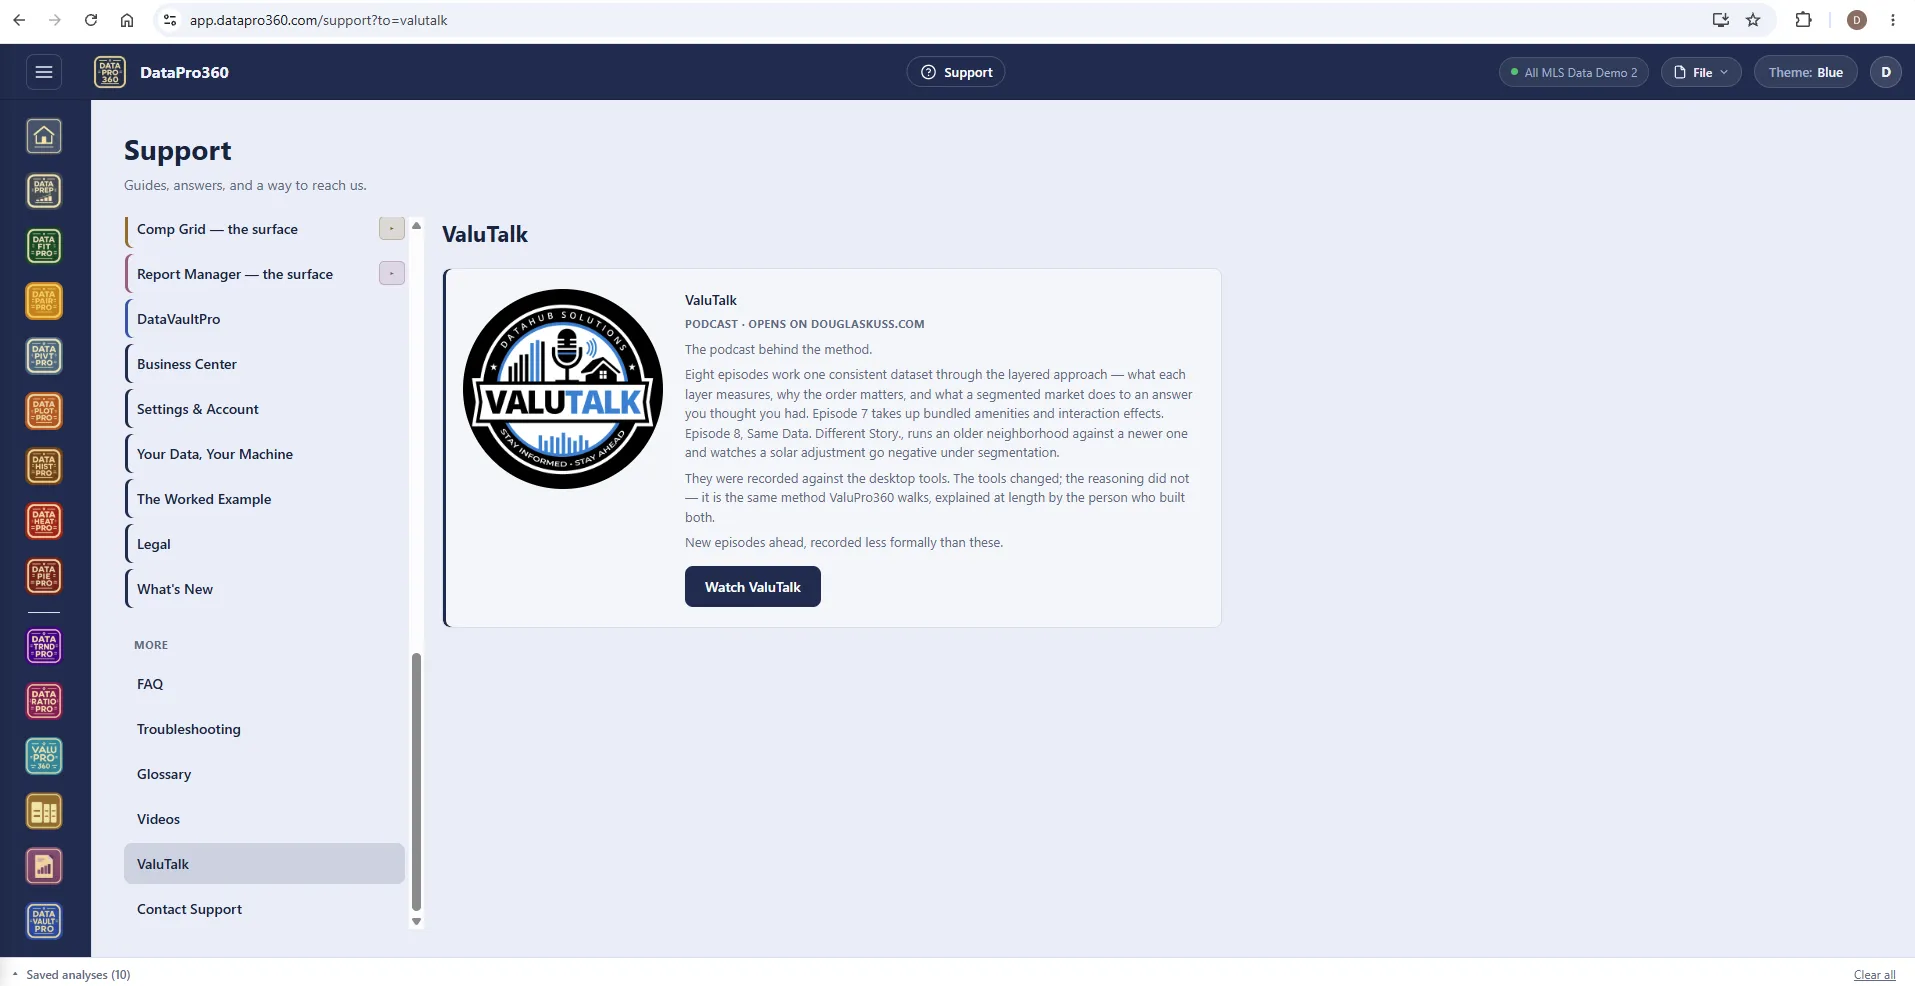
ValuTalk — the podcast behind the method.
Eight episodes work one consistent dataset through the layered approach — what each layer measures, why the order matters, and what a segmented market does to an answer you thought you had. They were recorded against the desktop tools; the tools changed, the reasoning did not. It is the same method ValuPro360 walks, explained at length by the person who built both.
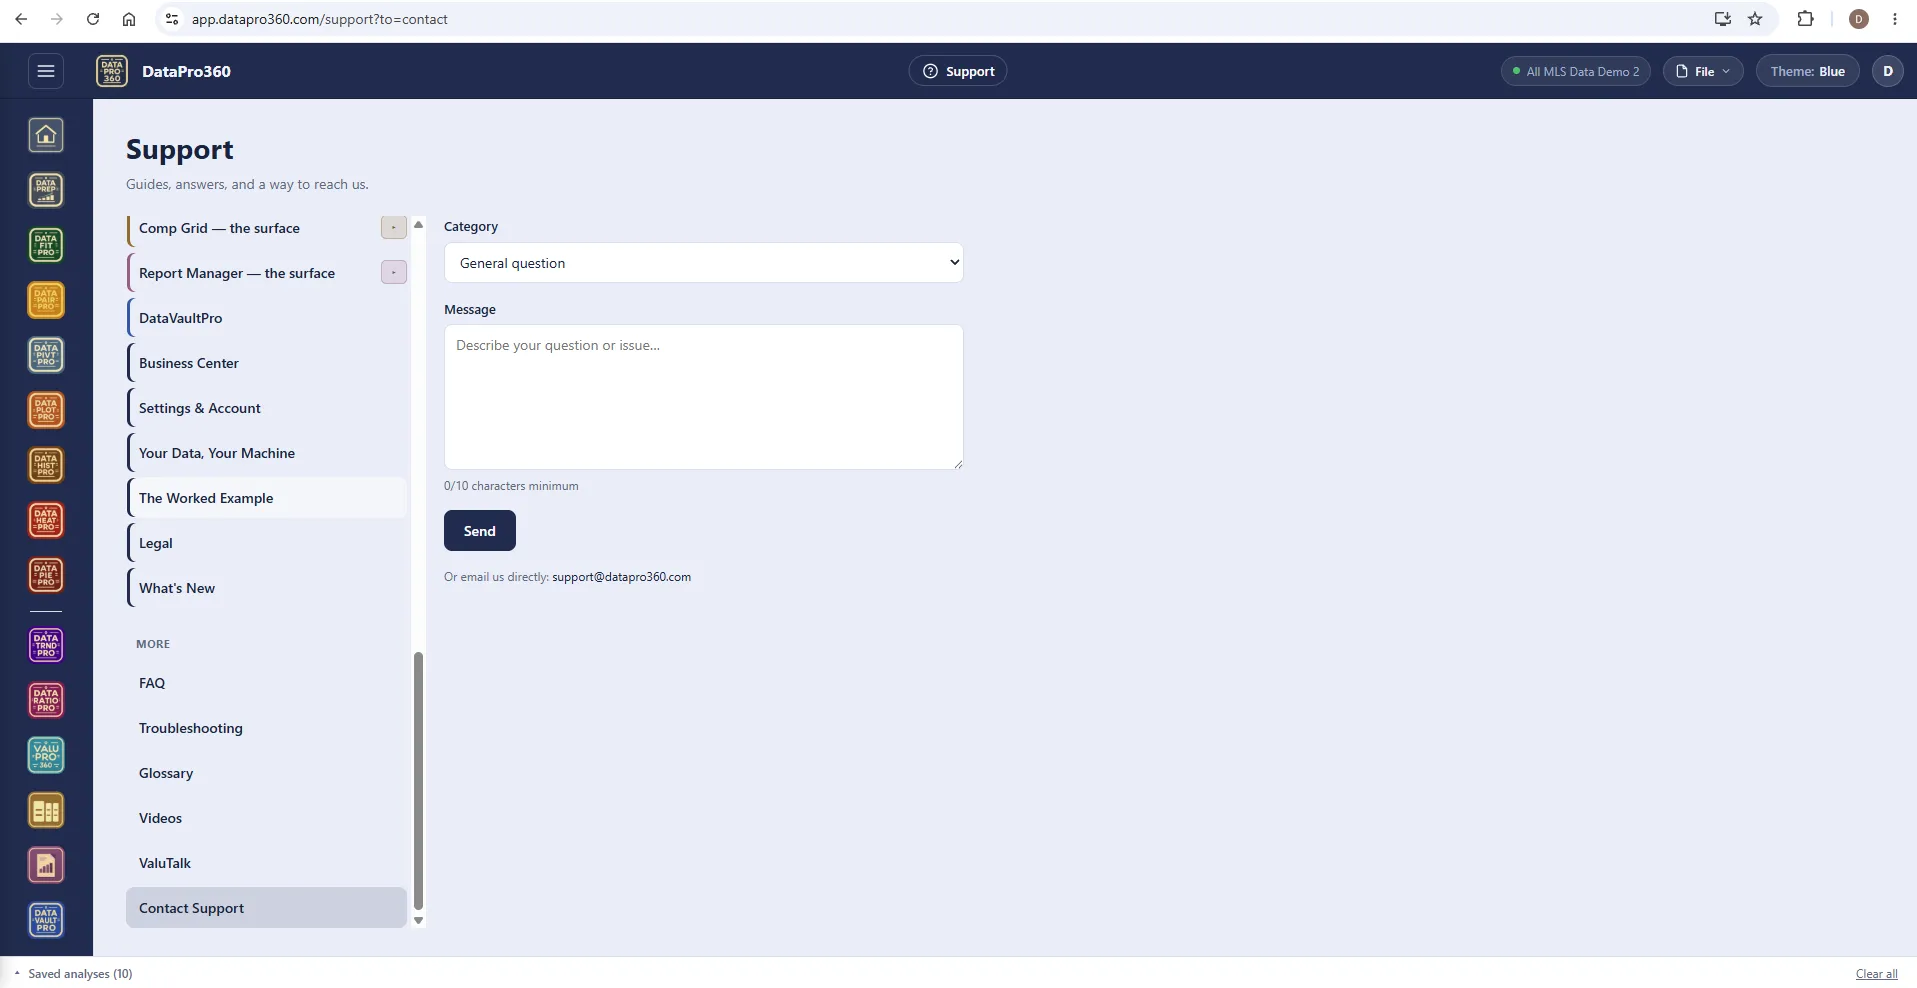
A real person, and a way to reach one.
Contact Support from inside the program — pick a category, describe the question — or email [email protected] directly. Questions about the method get answered by the person who built it.
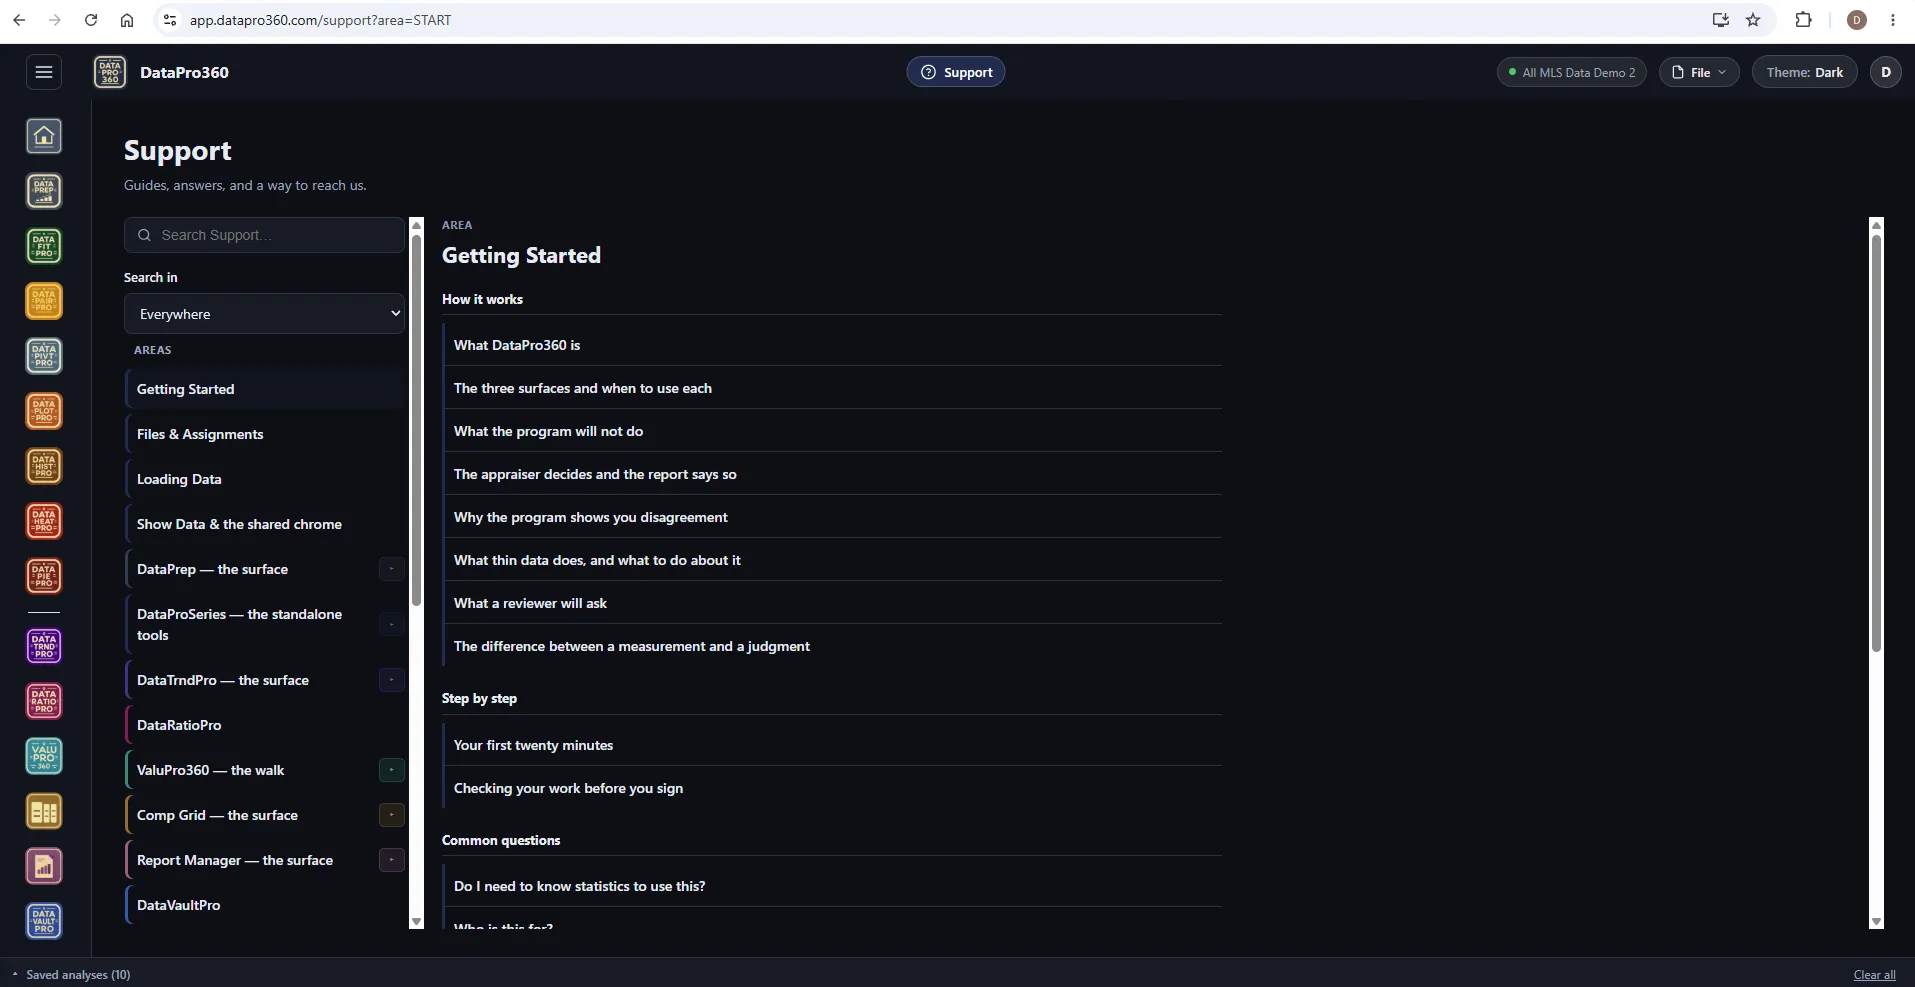
The same training ground, in the Dark theme.
Getting Started — how it works, step by step, common questions — on the dark workspace.
The worked example
One assignment, start to finish.
A real file, loaded and prepared, walked through all six stations, reconciled in the grid and assembled into a report. Each step shows what was on screen, what the evidence said, what was decided and why — preparing the file, looking at the data first, concessions, time, site size, GLA, amenities and the finding, the grid, reconciliation, the report. It is the fastest way to see how the pieces fit together, and it is worth an hour before you work your first live file.
Work a real file through the trial.
The training ground is inside the program from the first minute — load your own export and let the entries answer the questions as they come up.
$69.95 per user, per month. 30-day free trial, no credit card required. No long-term contract.