
DataPivtPro
Cross-tabulate one variable against another, with a statistic in every cell.
Pivot and cross-tabulate — summarize the data across categories.
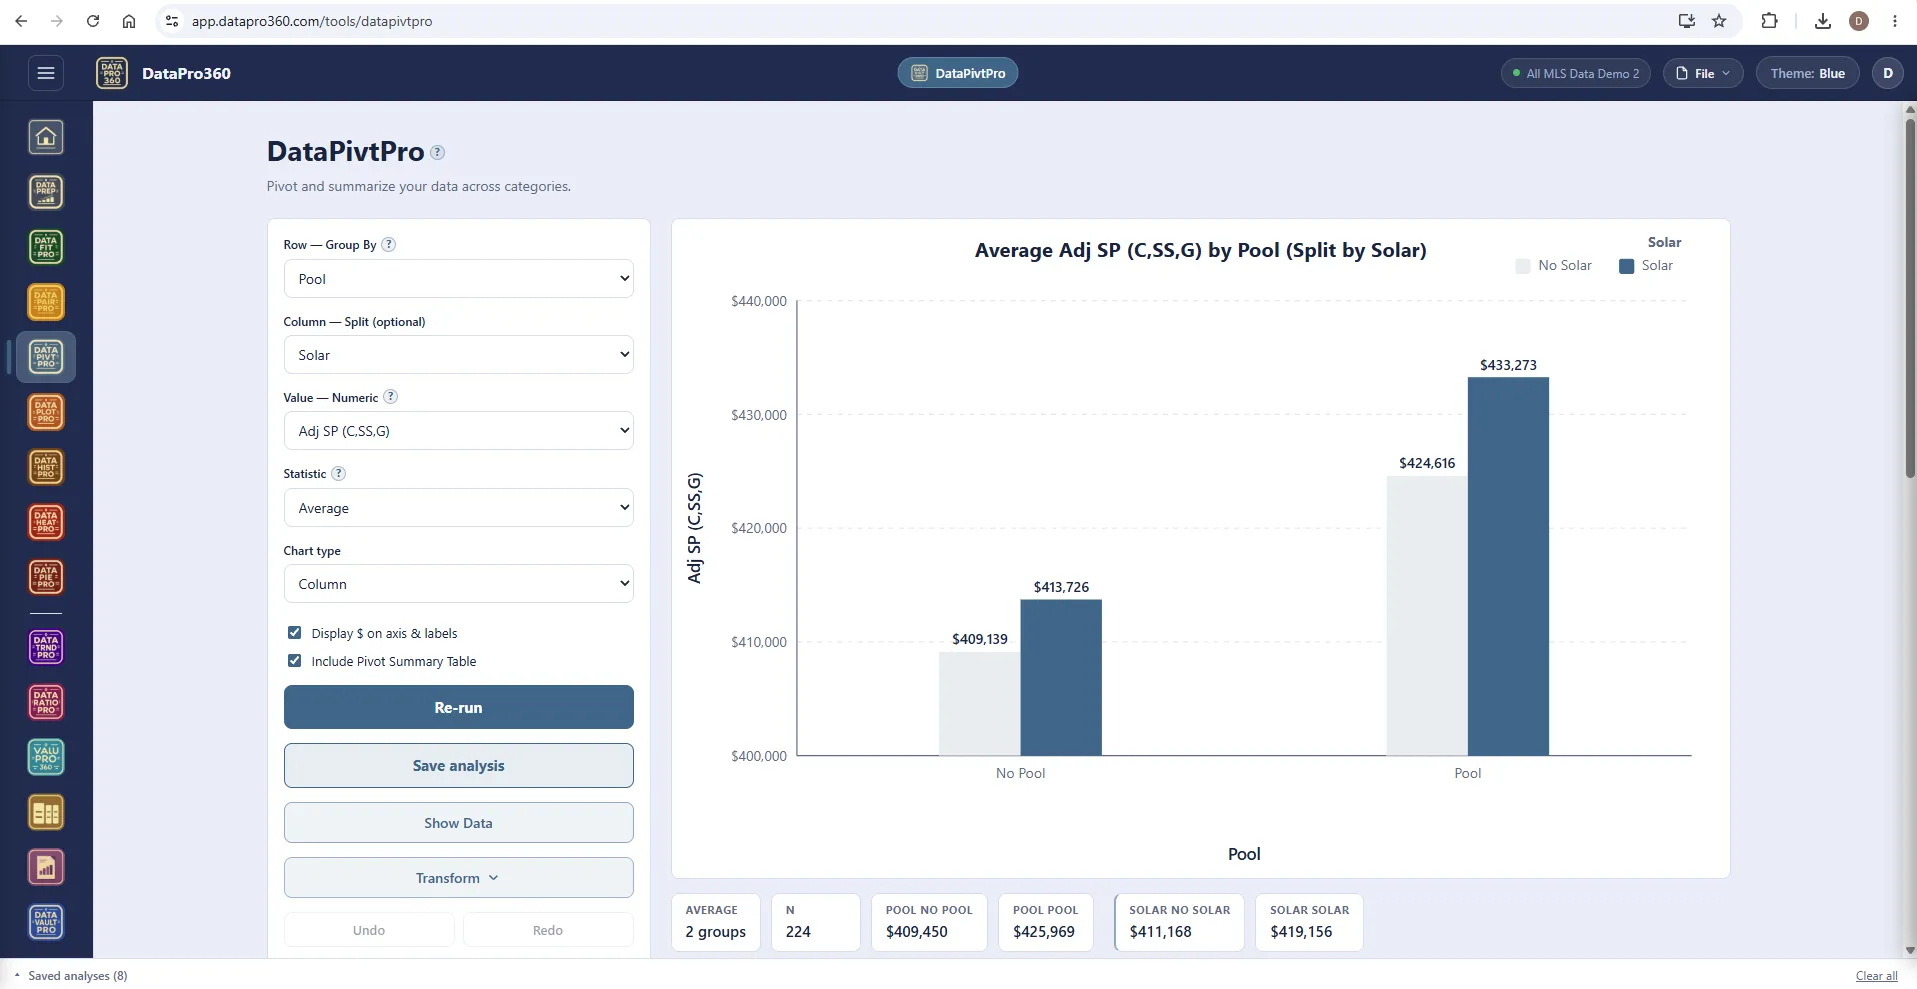
What it does
DataPivtPro cross-tabulates one variable against another, with a statistic in each cell. Rows are the values of one column; columns are the values of another; each cell holds a count, or the mean, median, sum or another statistic of a third column. It is the pivot table, built for a loaded dataset and wired to the same drill-through and curation everything else uses.
Group by pool, split by solar, average the adjusted sale price — and the chart draws the cells as grouped columns while the pivot summary table states every cell with its count. Watch the cell counts: a cell of five sales tells you less than a cell of a hundred and seventy-nine, and a value that differs wildly from its neighbors usually has a thin count behind it.
Use it to find structure before you measure it — whether a feature's premium holds across price bands, whether two features stack or overlap, whether a category is really two. Choose the statistic to match the question: means for magnitude, medians when the tails are heavy, counts when the question is composition.
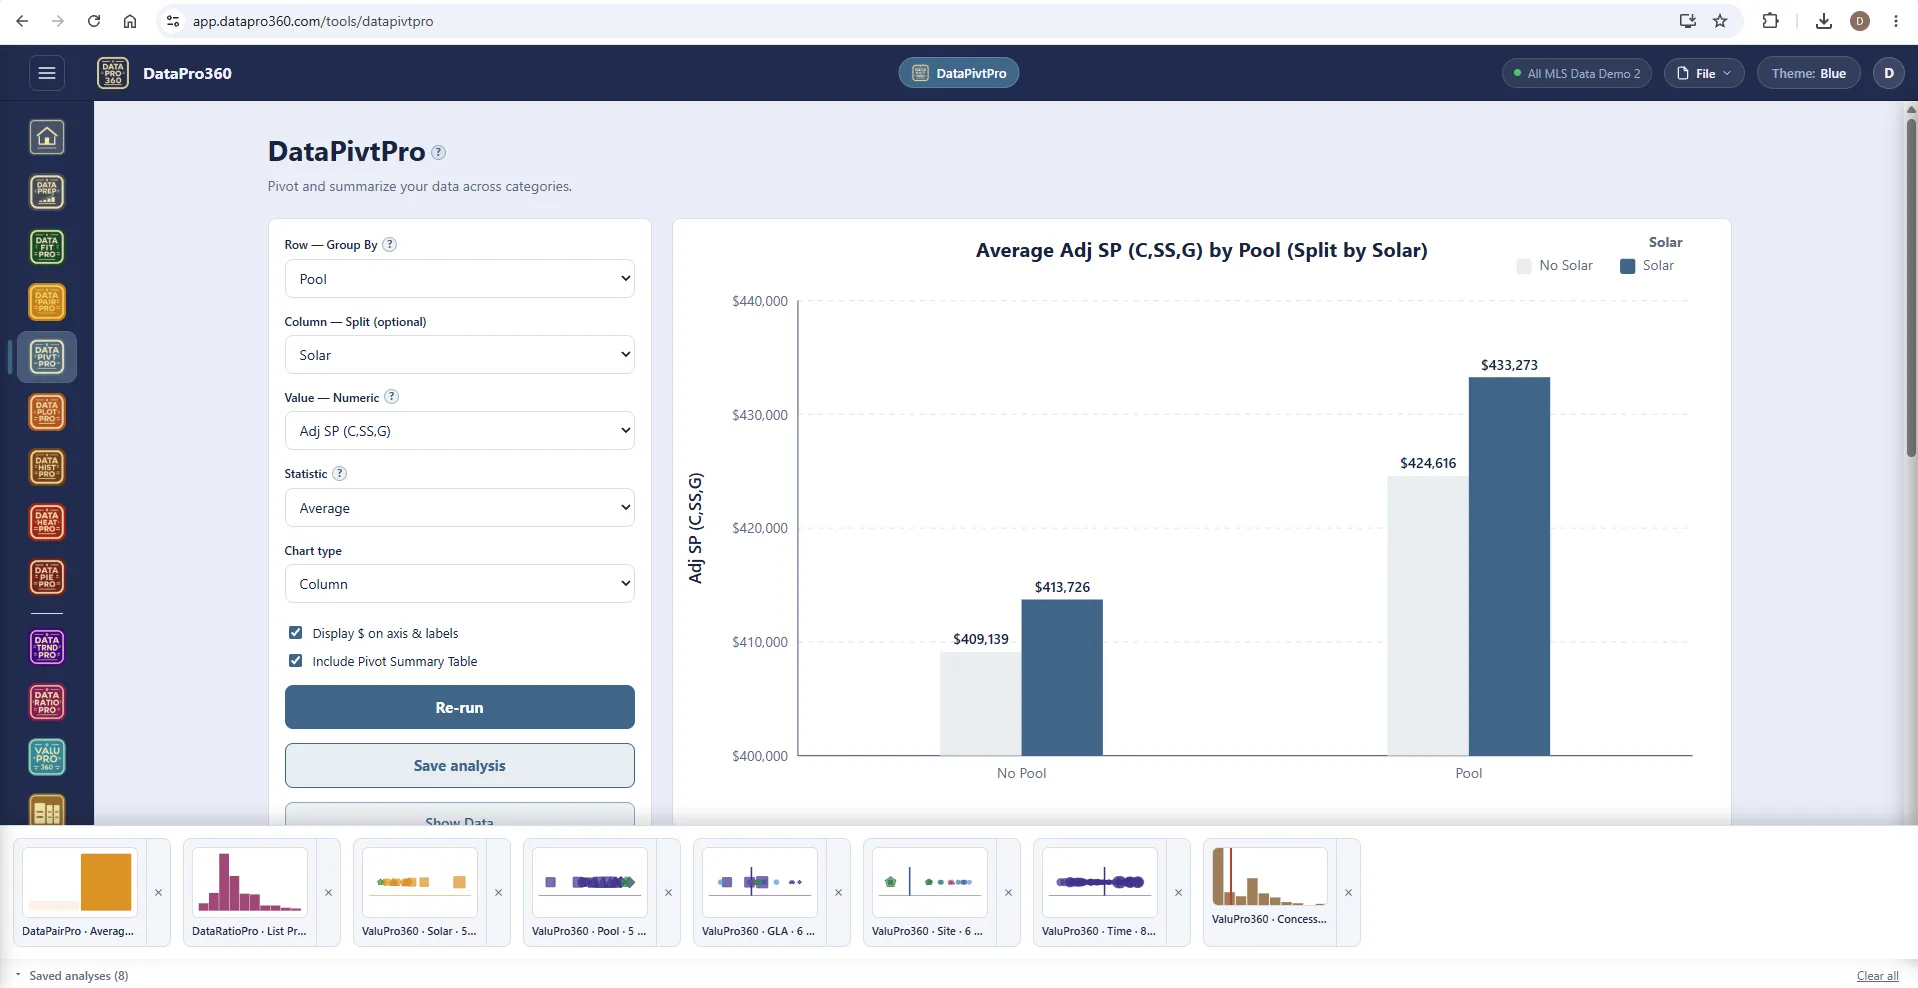
The tray of saved analyses.
Save a pivot and it joins the tray with every other analysis in the session — each in its tool's color, each ready to become a section of the report.
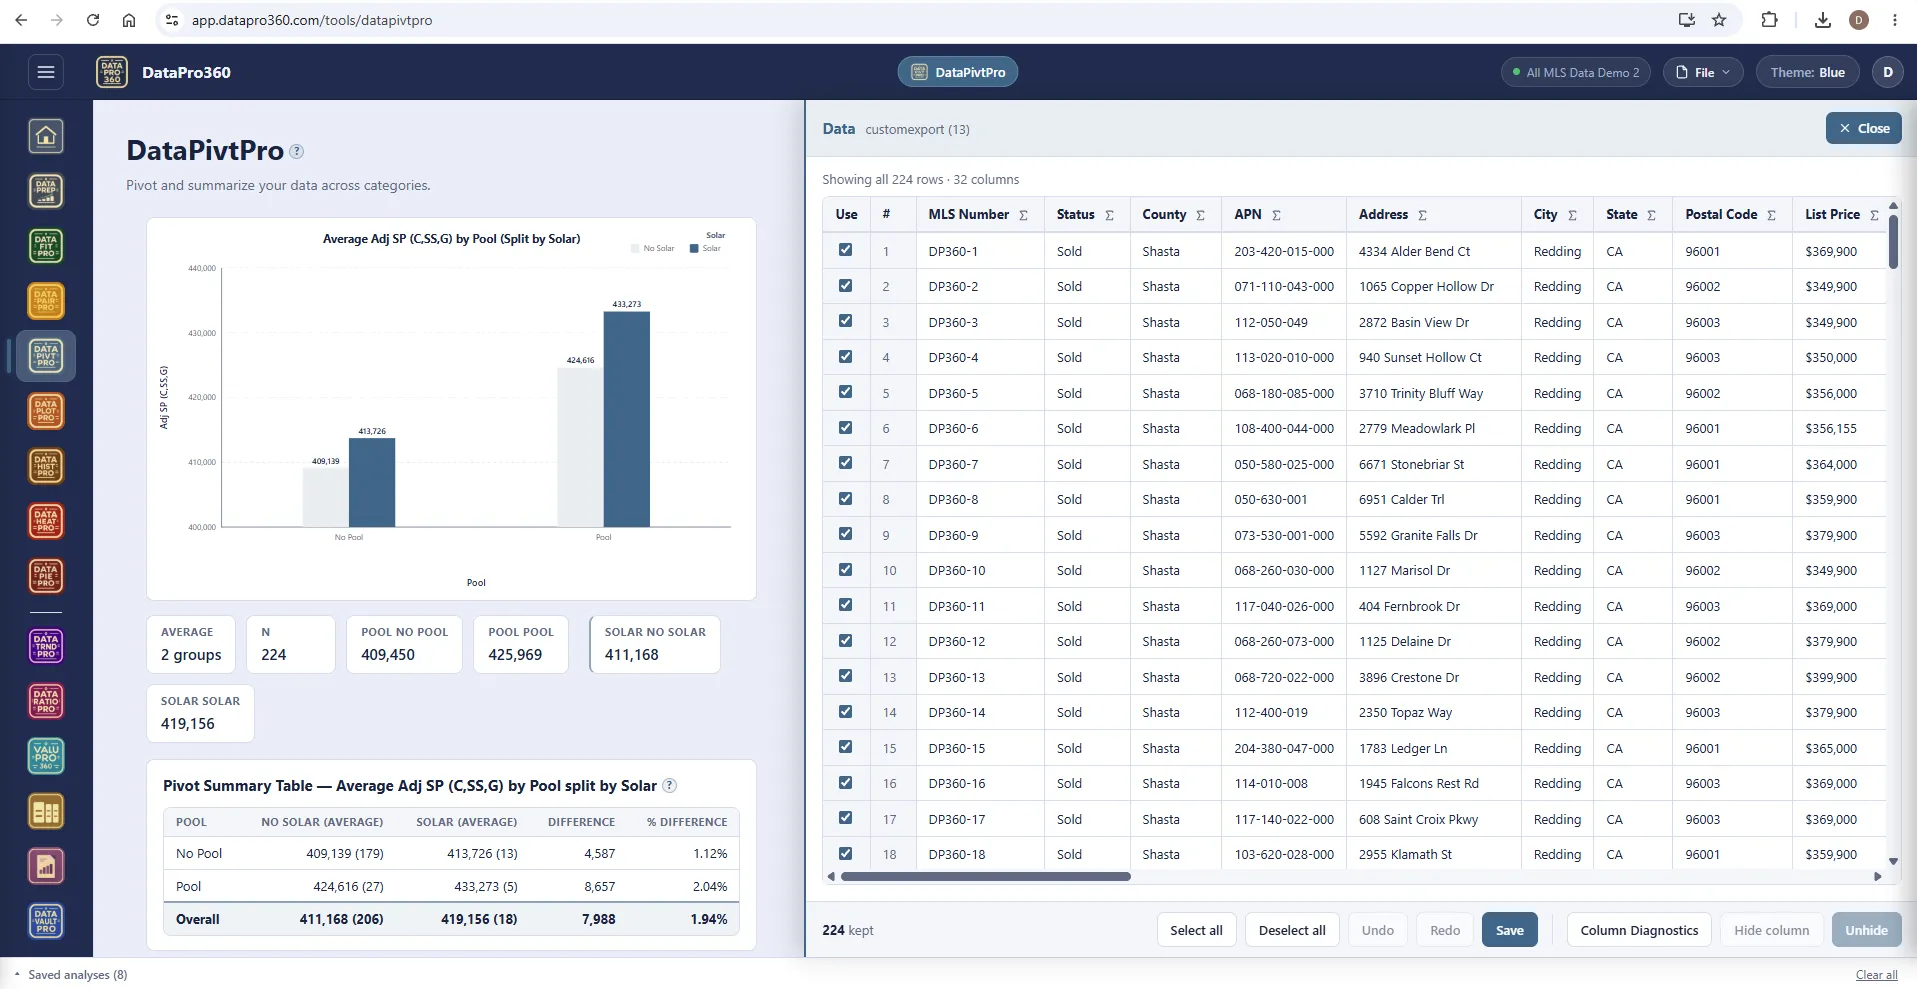
The pivot summary table, with the counts.
Every cell as a number, its count in parentheses, the difference and percent difference across the split, and an overall row. Show Data holds the rows behind the pivot; uncheck one and the cells recompute.
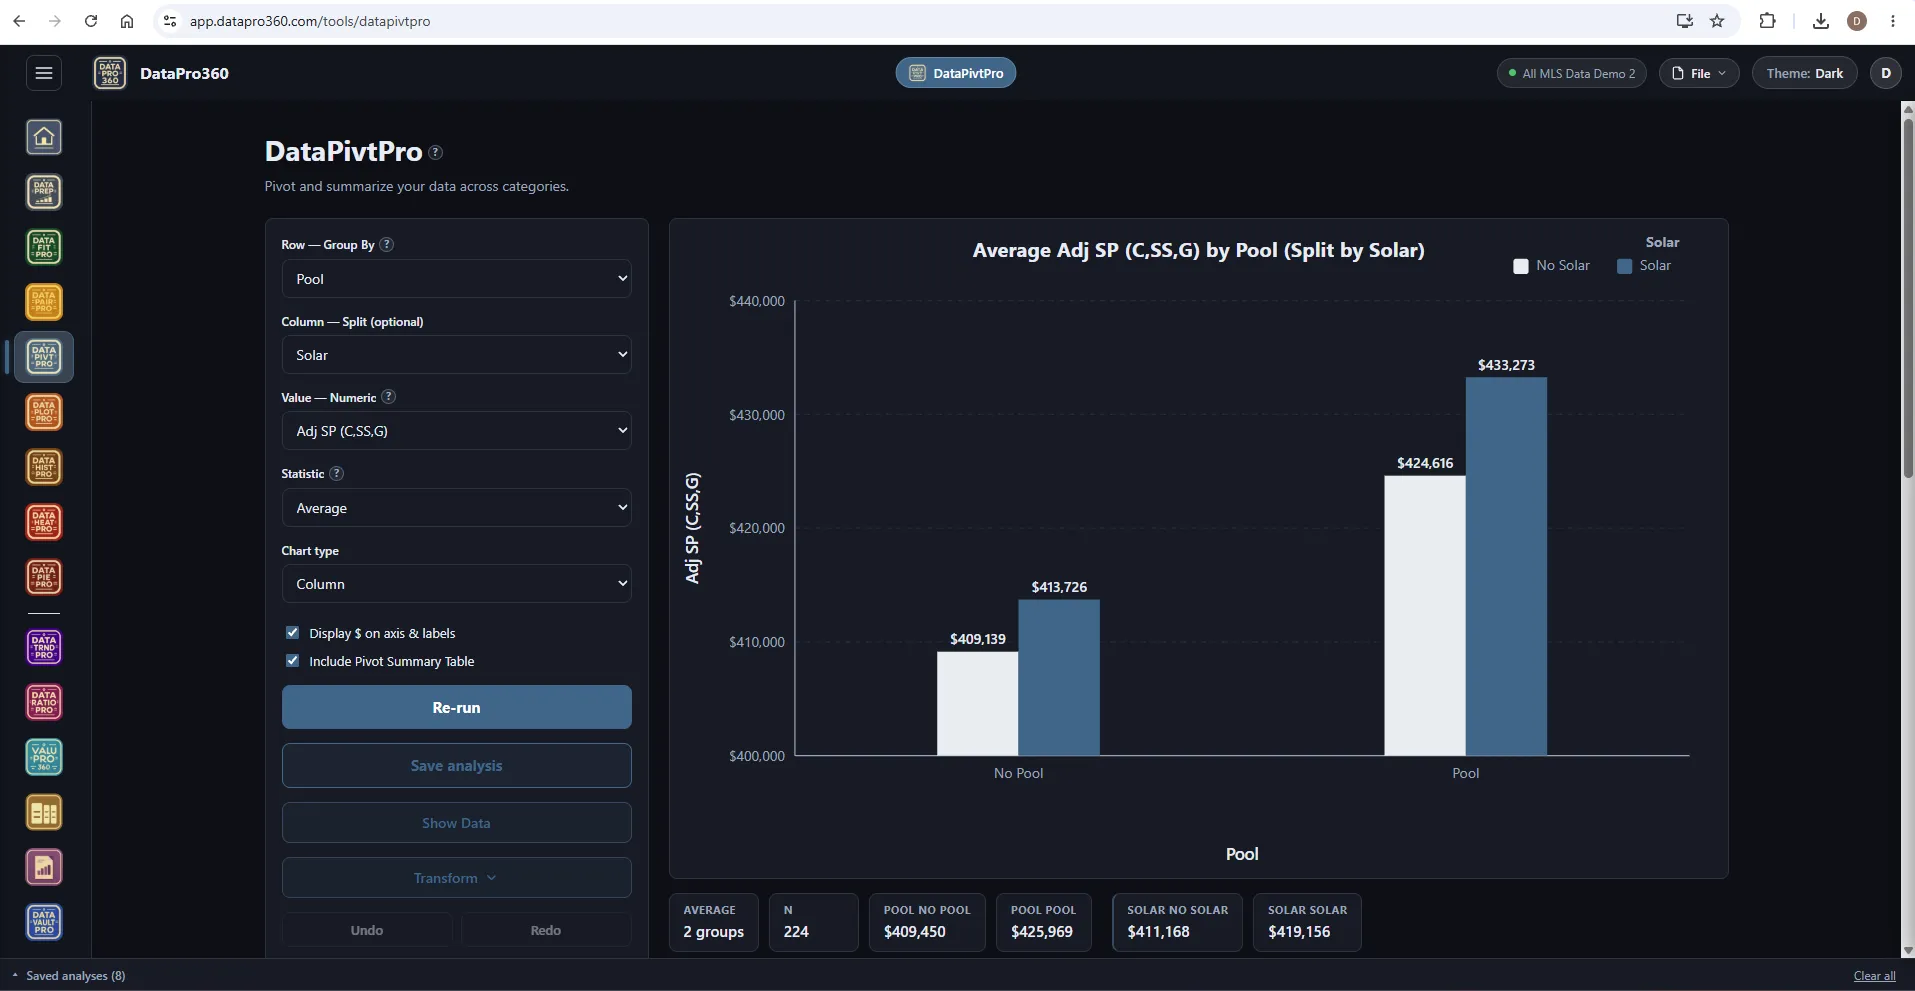
The same pivot in the Dark theme.
Grouped columns and the strip on the dark workspace.
Where it sits
In the workflow
DataPivtPro reads the prepared dataset, including the adjusted bases the ValuPro360 stations write. A saved pivot carries into Report Manager with its chart, table and narrative.
See the whole workflow →Before
 DataPrep
 ValuPro360
After
 Report Manager
Prove the numbers in your next report.
Load your own MLS export and work a real assignment through the trial — every chart, every method, the finished report.
$69.95 per user, per month. 30-day free trial, no credit card required. No long-term contract.