What is a paired sales analysis, and when does it actually work?
Douglas Kuss, Certified Residential Appraiser
A paired sales analysis takes two sales that are alike in everything but one difference and reads that difference's price straight from the two transactions. When real pairs exist, it is the most persuasive evidence an appraiser can put in front of a reviewer; when they do not, forcing it produces numbers that look like evidence and are not — so the honest questions are how alike the pairs really are, and how many independent observations you actually have.
What a paired sale is
Take two closed sales matched on location, size, age, condition — everything the market prices — except the one thing you are measuring. One has the pool, the other does not; one closed in March, the other in November. Whatever separates their prices is the market's own statement of what that one difference is worth. The same logic prices a feature, a site difference, or time itself: match sales that differ on the thing you are measuring and on as little else as possible, and read the difference.
The word "paired" covers a family. A single hand-matched pair is the classic. Grouped comparison — every sale with the feature against every sale without it — is pairing at the group level, and it lives or dies on the same question: are the groups alike in everything but the feature?
Why it is more persuasive than a regression when it works
A regression coefficient is an abstraction: a slope through a cloud, defensible but invisible. A pair is two addresses. A reviewer can pull both sales, look at both houses, and check the arithmetic on a napkin — nothing is held constant by a model, because it was held constant by the market. That checkability is the persuasion. When a clean pair and a regression agree, lead with the pair and let the regression corroborate; the two together are stronger than either alone, because they reach the same rate by unrelated routes.
When it does not work
Three failures account for most bad paired-sales exhibits. Thin pairs: one or two pairs are one or two observations, and a rate stated from them carries all the noise of the individual transactions — read the counts, because a group of forty against a group of three does not compare. Too many differences: if the "pair" also differs in condition, lot and garage, the price difference is the sum of everything, and assigning it all to the feature you happened to be measuring is attribution by hope. Overlap ignored: two groups can differ in their means and still overlap almost completely — a thirty-point gap between groups that each span two hundred points is inside the noise, and reporting the difference without the spread overstates what the data supports.
And the failure specific to software: the inflated pair count. A program that pairs combinatorially can report thousands of pairs from a modest file, and a pair count in the thousands does not mean thousands of independent observations — every pair reuses the same underlying transactions. Two thousand pairs from sixty sales are sixty sales. The pair count measures how thoroughly the file was combed, not how much evidence exists; the sale count is the evidence, and the honest exhibit states both.
A worked example
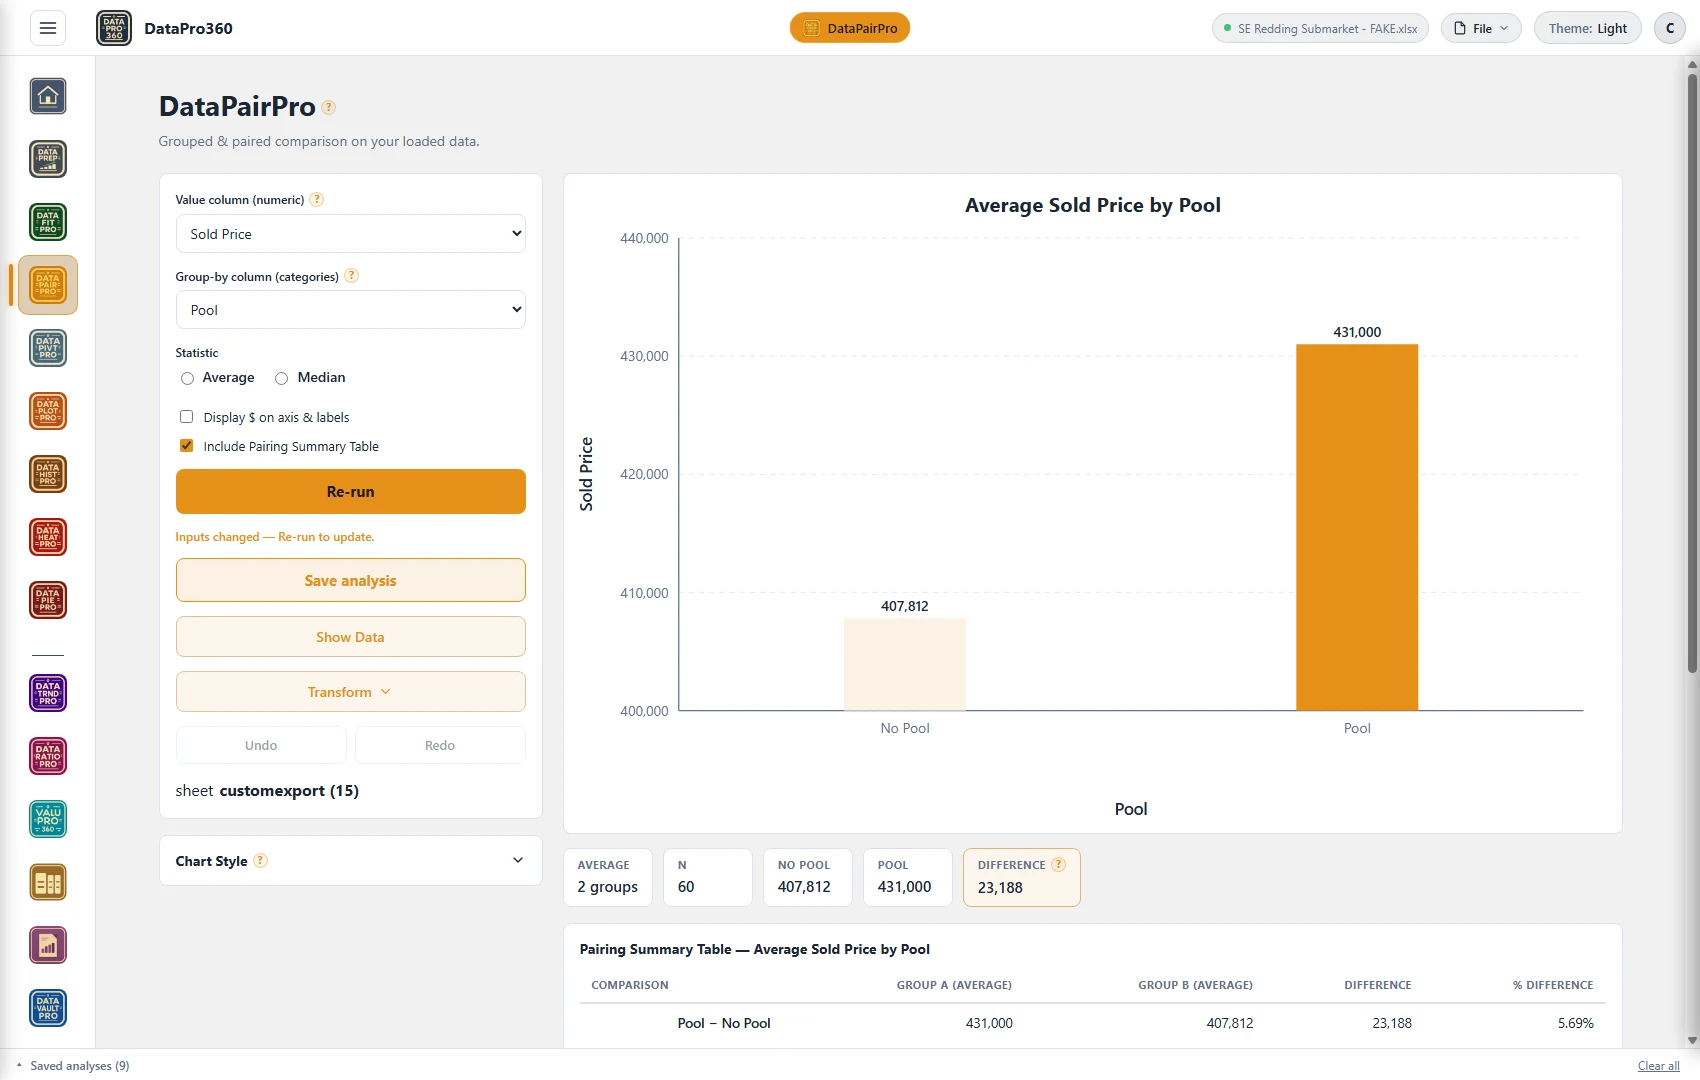
Here is a grouped comparison on a sixty-sale submarket pull: average sold price by pool. The sales without a pool averaged $407,812; the sales with one averaged $431,000 — a difference of $23,188, or 5.69%, across the two groups. That is a real gap, and it is also a raw-price gap: nothing here holds lot size, living area or market movement constant, so part of that $23,188 is whatever else travels with pools in this market.
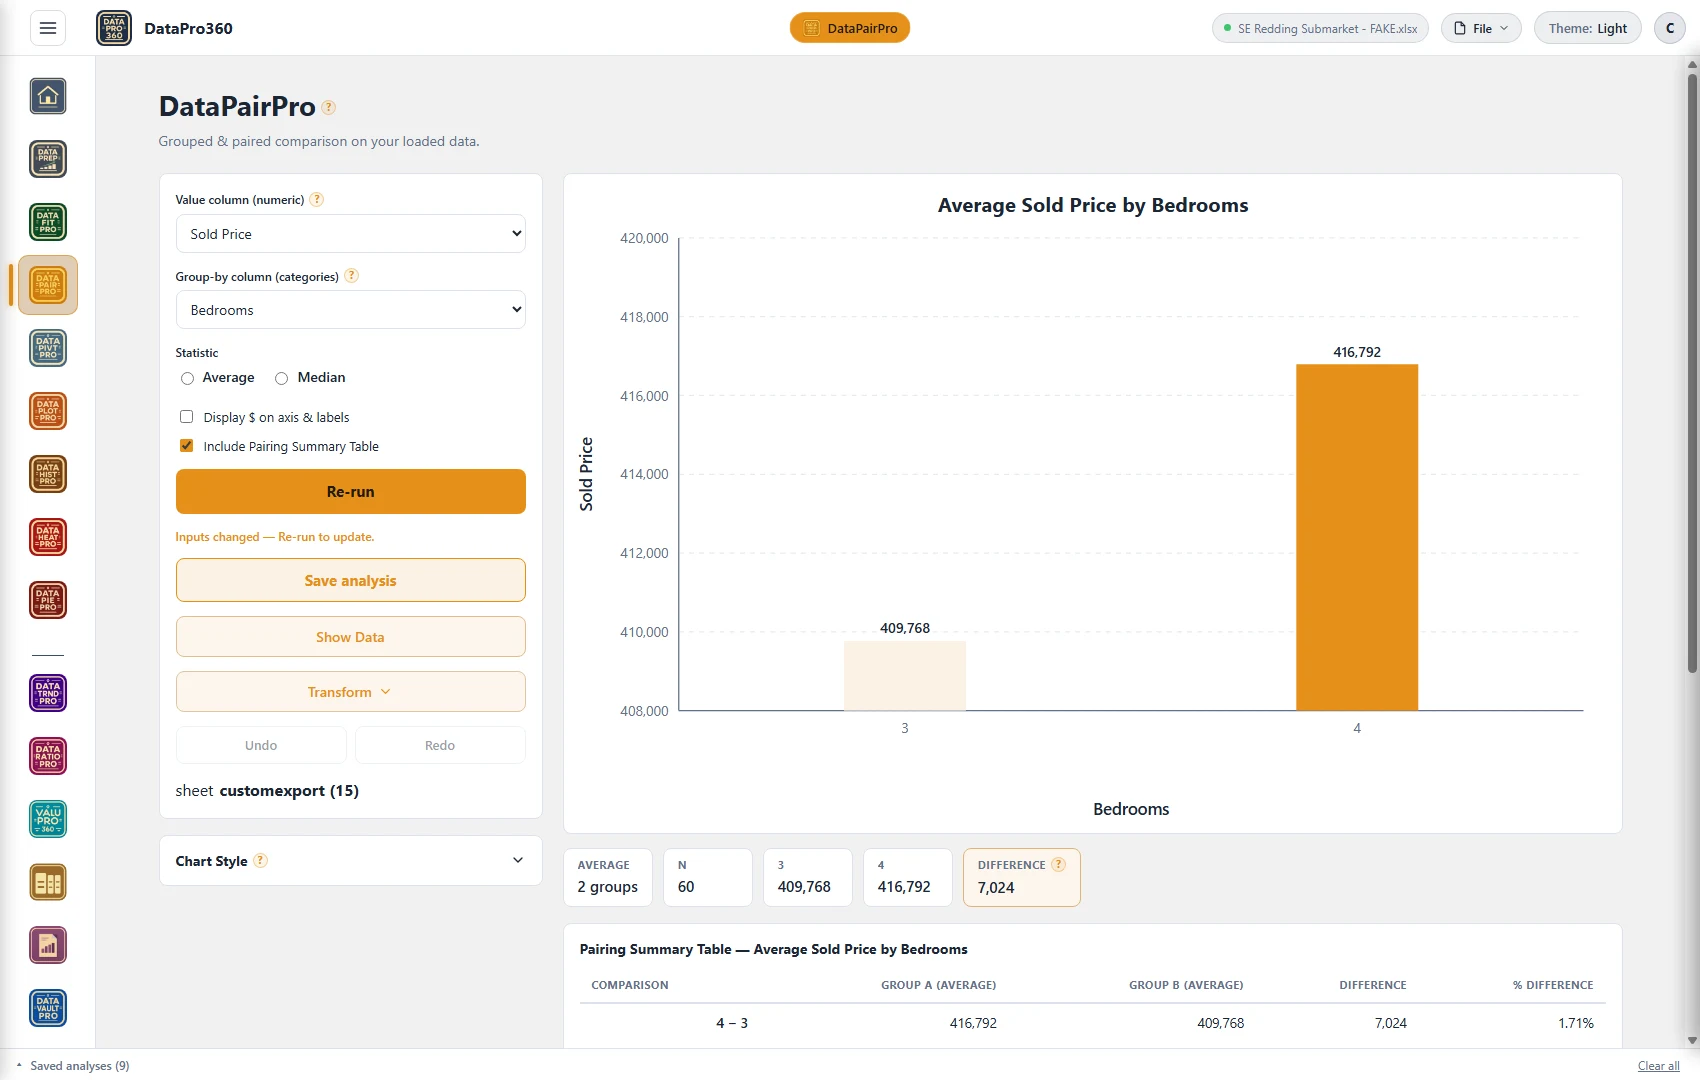
Now the same tool on the same sixty sales, split by bedrooms: three-bedroom sales averaged $409,768 and four-bedroom sales $416,792 — a difference of $7,024, or 1.71%. Set the two readings side by side and the discipline writes itself: a 1.71% gap between groups of ordinary spread is the kind of difference two random samples produce, and it should be reported with its overlap, not as a finding. The comparison is the start of the analysis, not the end of it.
Where paired sales sit among the other methods
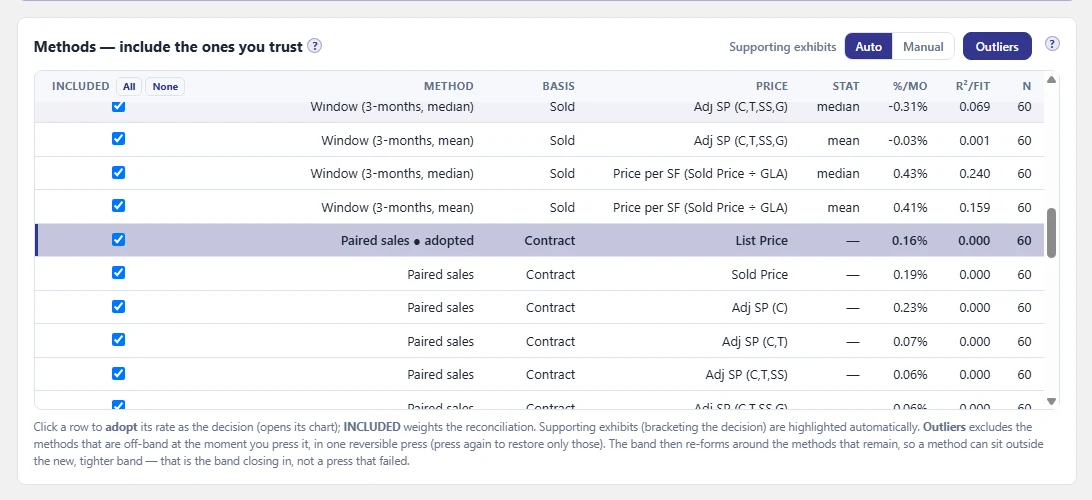
As one voice among several, never alone. In a market-conditions analysis, paired sales read the time rate from matched sales that sold at different dates, alongside regressions and window methods reading the same sales other ways. In the methods table below, the paired-sales rows run across five price bases — and the appraiser has adopted the paired-sales reading, at 0.16% per month, as the decided rate, with the other methods standing as the check on it. Note the n column: every paired row says 60, because sixty sales are what the file holds, however many pairs were formed from them.
The same discipline runs through the time adjustment, the site rate, the living-area rate and the amenity values: paired sales appear as a method row in each, weighted by how clean the pairs actually are, and the convergence of unlike methods is the evidence.
What belongs in the report
The pairs themselves — addresses, dates, prices, and the differences you matched away — not just the concluded rate. The sale count as well as any pair count, with a sentence saying which one is the evidence. The spread and the overlap alongside the difference. And where the pairs were thin or confounded, say so and lean on the methods that do not need them; a paired exhibit offered honestly as corroboration reads better in review than one dressed up as proof.
Doing this in DataPro360
DataPairPro runs grouped and paired comparisons on your own loaded sales and reports each group's statistics, the difference, and the overlap — the part that decides whether the difference means anything. In the adjustment stations, paired sales run as one method among several on every price basis, with their sale count stated, so the pairs argue alongside the regressions instead of instead of them.