How do I derive a site size adjustment when lot sizes vary?
Douglas Kuss, Certified Residential Appraiser
You derive it by measuring what the market pays for land from your own sales — reading sale price against site size several independent ways — and, where the improved sales cannot support a rate, from vacant land sales, which price land directly. Lot size is rarely worth a flat figure: an extra half acre does not carry the same worth on a quarter-acre street as it does in open country, so the rate has to be measured rather than assumed.
Why the adjustment exists at all
The site adjustment removes the land difference between a comparable and the subject before anything about the improvements is compared. Until it is out, a larger-lot comparable reads as a more valuable house, and part of what you later measure as living area or amenity value is actually acreage.
Two traps sit in this layer. The first is units: acres and square feet differ by a factor of 43,560, and a unit error here is silent — nothing about the resulting adjustment looks obviously wrong. State the unit everywhere the rate appears. The second is shape: land does not price linearly. The first acre of a parcel carries the house, the driveway and the utility; the tenth carries pasture. A per-acre rate derived from one-to-five-acre parcels does not extend to twenty acres, and a report that applies it there without saying so has a problem a reviewer will find.
The methods, and why you use more than one
Each of these reads the same sales a different way:
- Linear regression fits price against site size; the slope reads directly as dollars per unit of land.
- Theil-Sen takes the median of pairwise slopes, so a few odd sales cannot drag the rate.
- Quantile regression fits the median of the price distribution rather than the mean.
- Paired sales match sales that differ in site size and little else and read the rate from each pair.
- Grouped medians band the sales by size and read the rate from how the band medians step.
- Log-log (elasticity) fits the relationship so the dollar rate declines as parcels grow — the right shape for diminishing returns.
- Marginal rate at anchor reads the fitted slope at the size you anchor on — what one more unit is worth for a parcel like the subject.
- Controlled coefficient fits site size alongside living area, so the land rate is read with the house held constant.
And separately: the land pool. In many markets the improved sales do not vary enough in lot size to measure a rate reliably. Vacant land sales are market participants pricing land directly rather than land inferred from improved prices, and in a rural market they are frequently the better evidence. Where both pools are available and agree, you have two roads to the same rate — and the report should say so.
What convergence looks like
Here is a worked example from a sixty-sale submarket pull, and it is worth showing precisely because it is not tidy.
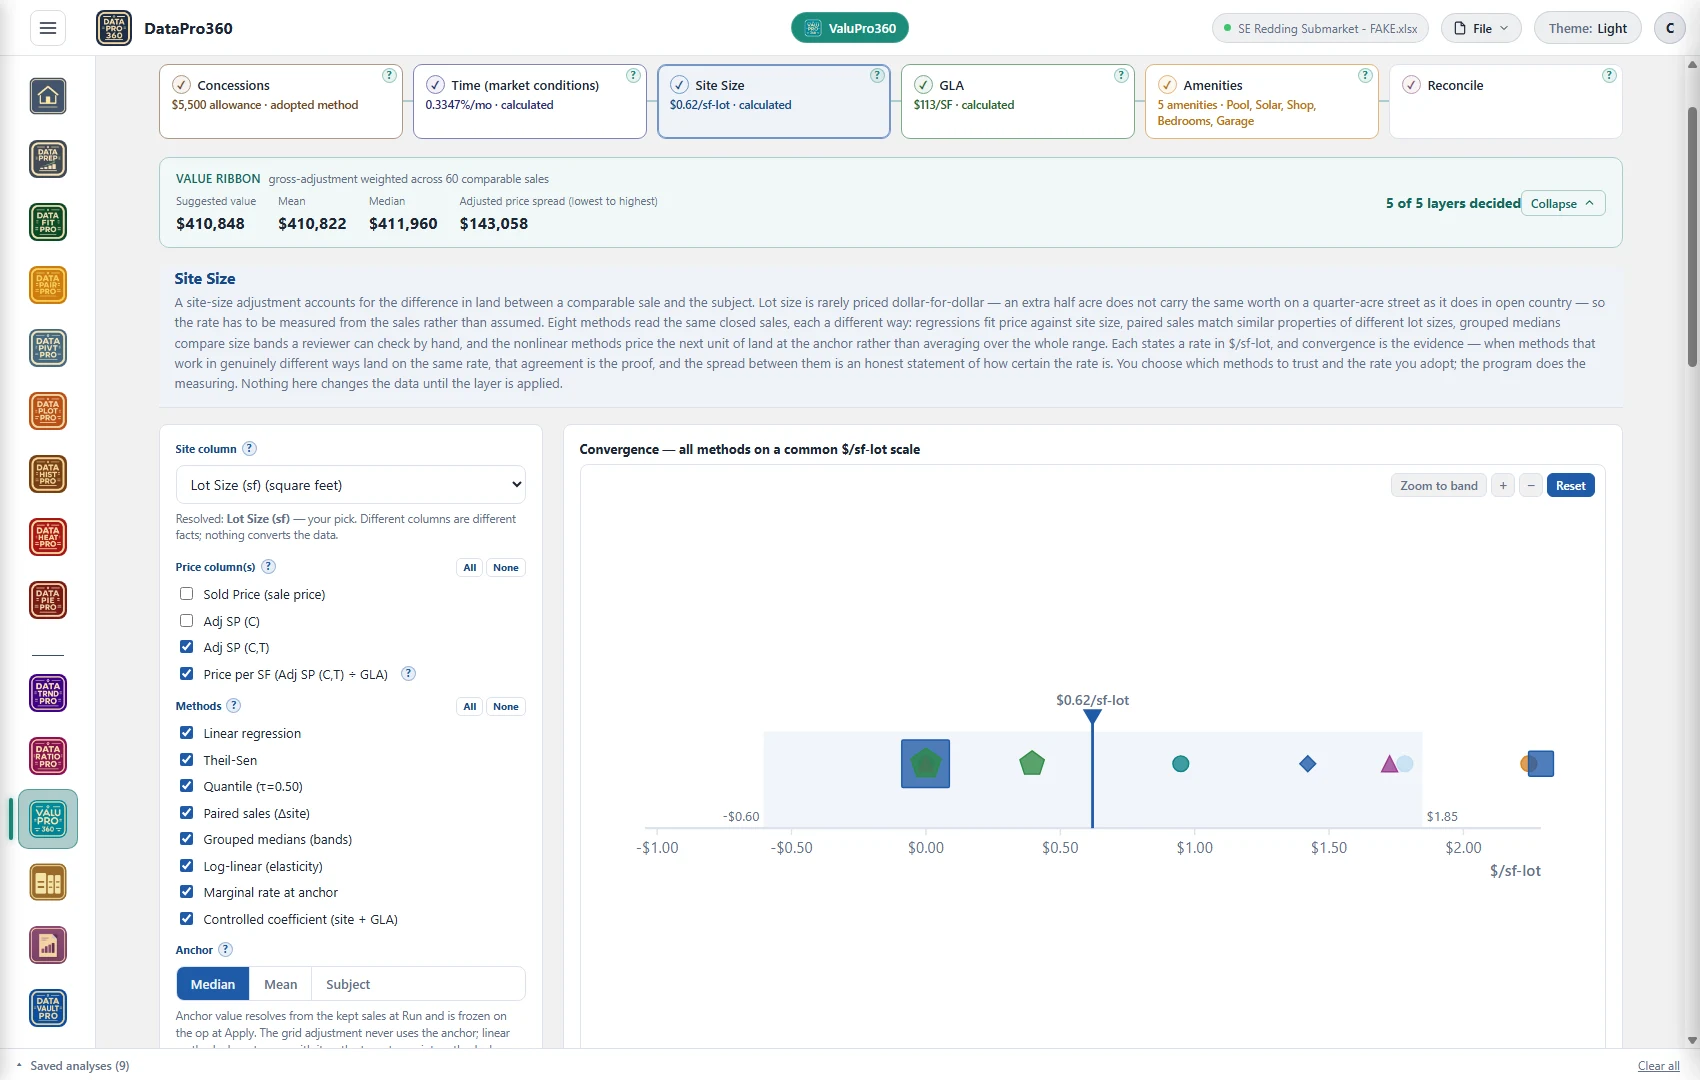
The improved-sale read ran eight methods across two price bases — the concession-and-time-adjusted price, and that price per square foot of living area — pooled on one dollars-per-square-foot-of-lot scale. The calculated rate came to $0.62 per square foot of lot at the median anchor, but the band ran −$0.60 to $1.85 — a spread that crosses zero. Be careful with a strip like this: the two bases are different quantities (a slope in whole dollars and a slope in dollars per square foot of house are not the same measurement), and a band this wide is not convergence. It is the data saying the improved sales cannot pin the land rate down on their own — which is exactly the situation the land pool exists for.
The land pool told a steadier story. Twenty-five vacant land sales, read by six methods, converged at $4,544 per acre at the six-acre median anchor, with the band running $4,113 to $4,974 and 5 of the 6 methods included, against a $77,000 reference land price. Move the anchor to the 10.66-acre mean and the rate falls to $4,183 per acre — diminishing returns, visible in the numbers. In the table, linear regression at $4,071 and quantile at $4,095 sat off-band and were flagged; Theil-Sen read $4,344.

When the improved sales cannot support a rate
An improved sale's price is mostly the improvements. The house, the driveway and the utility ride on the first acre, so the land's contribution is a residual — a slope teased out of prices that mostly reflect everything built on the land — and it is confounded by whatever travels with lot size in your market: bigger houses, better shops, longer setbacks. Unless the improved sales vary widely in lot size and little else, the methods are reading that noise, and a band like the one above — crossing zero — is the honest result.
Pricing land directly does what the improved sales cannot. A vacant land sale is a market participant paying for land and nothing else — no inference, no residual, no house to hold constant. That makes the land pool first-class evidence rather than a fallback: a different kind of reading, and in a rural market frequently the better one.
On the twenty-five land sales the frame above shows, that directness is visible in the numbers. Six methods converged at $4,544 per acre at the six-acre median anchor with the band running $4,113 to $4,974 — a band that does not cross zero, or come near it — with 5 of the 6 methods included and the two that sat off-band, linear regression and quantile, flagged as outliers rather than silently averaged in. The same market whose improved sales could not say whether land added or subtracted value prices its vacant land inside a nine-hundred-dollar range.
When the two reads disagree, the decision is about the quality of each read, not a split of the difference. Ask what each is actually measuring: an improved-sale band that crosses zero is not a rate near zero — it is the method saying it cannot isolate the land — while a tight land-pool band is a measured rate with stated support. In that situation the land pool decides, and the narrative says so: the improved sales were run, the spread is reported, and the concluded rate stands on the vacant sales, restricted to the size range the subject sits inside. Where both pools support a rate and agree, you have two roads to the same number, and the report should say that instead.
Where this adjustment sits in the sequence
Third. Concessions come off first, the time adjustment brings every sale to the effective date, and the site rate is then measured on that concession-and-time-adjusted price. The living-area rate and the amenity values follow, each on the layer this one leaves behind — which is the reason site comes before living area at all: a bigger house on a bigger lot must not be charged twice.
What belongs in the report
The rate, with its unit stated everywhere it appears; the anchor it was read at; the price basis; which pool it came from — improved sales, land sales, or both, and whether they agreed; the size range the rate was derived from, and what you did about comparables outside it. If the improved-sale spread was wide, say so and say why you concluded where you did. An honest paragraph about a bending relationship is worth more in review than a suspiciously clean single rate.
Doing this in DataPro360
DataPro360's Site Size station runs the eight methods against your own sales, keeps the vacant-land pool as its own rate card with its own methods and decision, and shows the anchor sensitivity so diminishing returns are visible rather than assumed away. The unit toggle converts values explicitly, and the decided rate carries to the grid with its provenance.