What methods can I use to derive a GLA adjustment?
Douglas Kuss, Certified Residential Appraiser
Eight methods, each reading the same closed sales a different way: regressions that fit price against living area, paired sales matched on size, grouped medians across size bands, and nonlinear methods that price the next square foot at an anchor rather than averaging over the whole range. What you must not use is price per square foot — dividing sale price by living area produces a different quantity, and using it as an adjustment rate is a large error.
Why the adjustment exists at all
A GLA adjustment accounts for the difference in gross living area between a comparable and the subject. Square footage is rarely worth one flat figure — the last two hundred square feet of a large home do not carry what the first two hundred do — so the rate has to be measured from the sales rather than assumed.
The point most reports miss is the difference between an average and a margin. Price per square foot divides everything — the lot, the kitchen, the roof, the systems, the garage — by the living area. The adjustment rate is the marginal worth of one additional square foot with everything else held constant, and it is systematically smaller. A grid that adjusts GLA at the average and then adjusts site, garage and condition separately charges for the same things twice.
The methods, and why you use more than one
Each of these reads the same sales a different way:
- Linear regression fits price against living area; the slope reads directly as dollars per square foot.
- Theil-Sen uses the median of pairwise slopes, resistant to the odd sale.
- Quantile regression fits the median of the price distribution, steadier when prices are skewed.
- Paired sales match sales that differ in living area and little else; the pair count matters as much as the rate.
- Grouped medians band the sales by size — a coarse, steady read a reviewer can check by hand.
- Log-log (elasticity) fits the shape where each additional square foot adds less than the one before, which larger homes commonly show.
- Marginal rate at anchor reads the fitted slope at the size you set — what one more square foot is worth for a home like the subject.
- Controlled coefficient fits living area alongside site size, so the two cannot absorb each other.
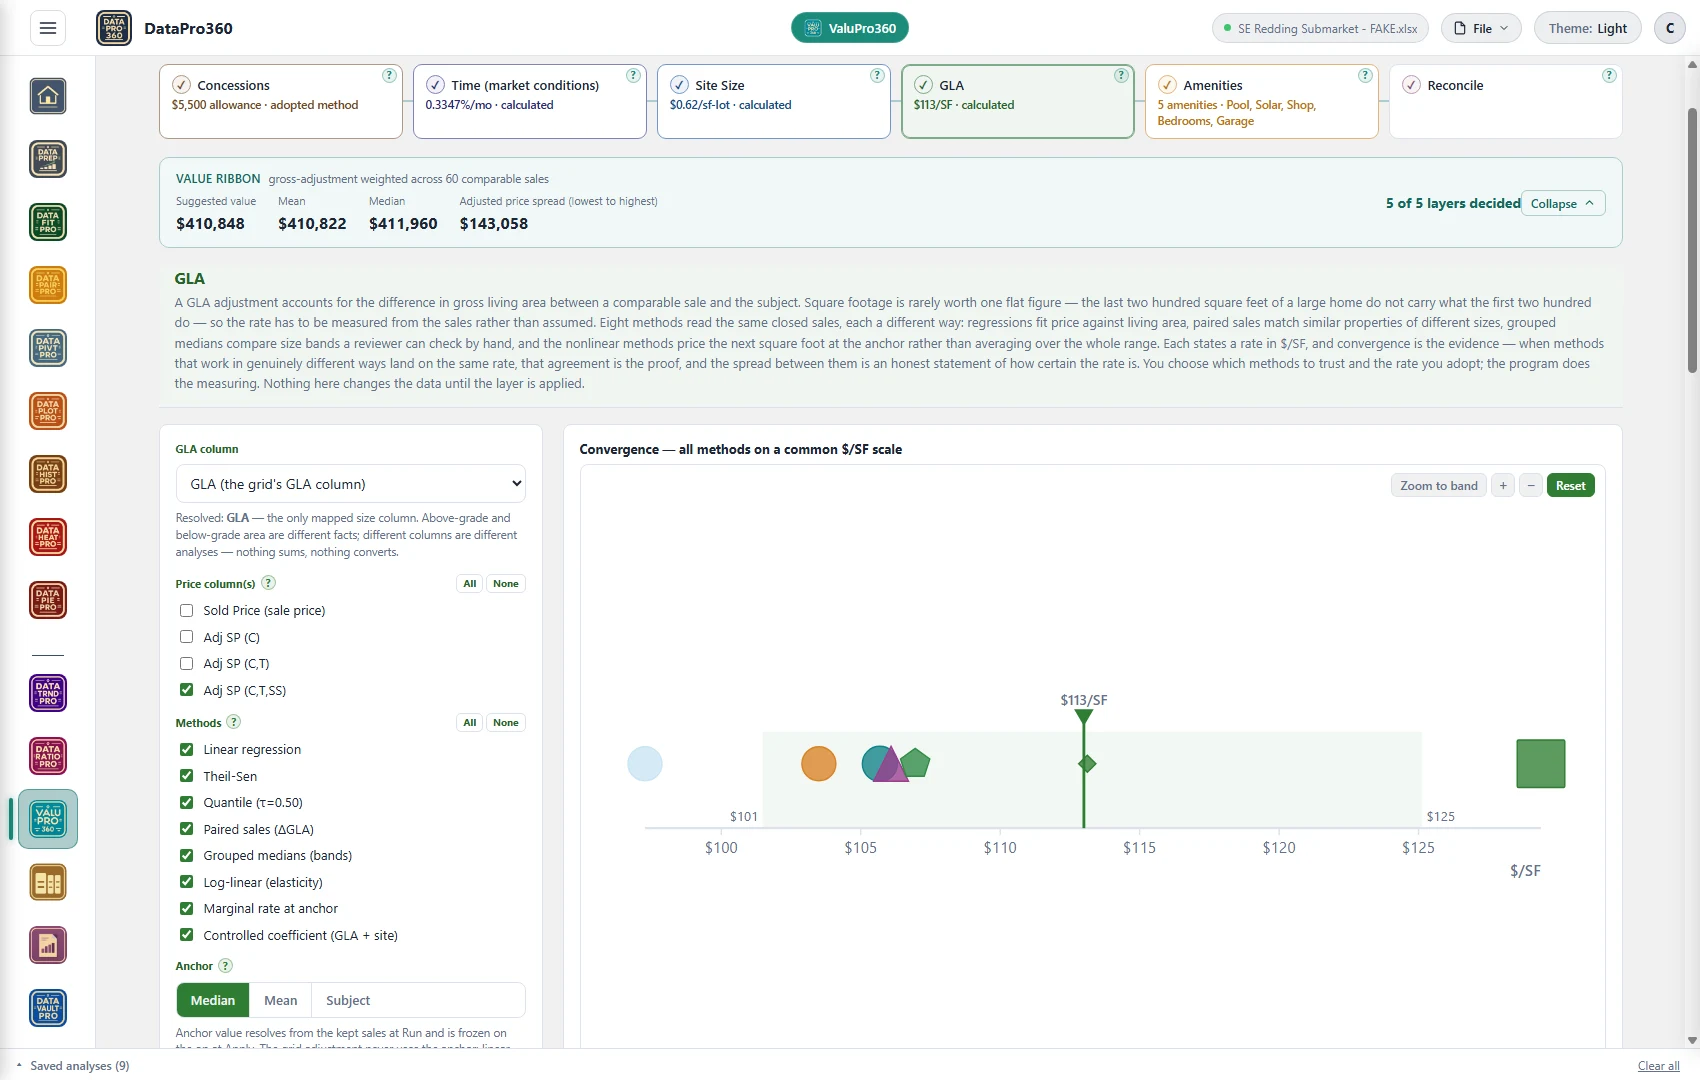
The anchor matters, and it separates the methods honestly: the linear methods state one slope for the whole range and do not move with the anchor; the two at-a-point methods — log-log and marginal rate at anchor — price the next square foot at the anchor, so their rate falls as the anchor grows. If those two disagree with the linear ones, that disagreement is the market telling you size is not worth a straight line, and where you set the anchor becomes part of the finding.
What convergence looks like
Here is a worked example from a sixty-sale submarket pull — kept short, because the one frame below is the read.
All eight methods ran against the fully layered basis — the price with concessions, time and site size already removed — with the anchor at the median. The calculated marginal rate came to $113 per square foot, with the agreement band running $101 to $125. That band is the honest statement of certainty: a tight dollar band around a support-weighted center, derived on a basis that no longer carries the layers already decided.
And here is where that rate goes. In the grid, the GLA row carries the station's decision by name — ValuPro360 · GLA · $113/SF — and does the differencing against an 1,800-square-foot subject: a 1,668-square-foot comparable is 132 square feet short, so it adjusts +$14,916; an 1,830-square-foot comparable is 30 square feet over, so −$3,390; a 1,508-square-foot comparable takes +$32,996. Every figure is the size difference times the measured rate — you state the rate once, where you derived it, and the grid applies it.

Where this adjustment sits in the sequence
Fourth. Concessions, time and site size are already out of the price this rate is measured on — that is why the marginal rate can be trusted not to be carrying acreage or market movement. The amenity values are measured after it, on the layer this one leaves behind.
What belongs in the report
The rate, the anchor it was read at, the price basis it was derived on, how many methods ran and how many agreed, the band, and the sample. If the at-a-point methods separated from the linear ones, say so and say which shape you followed. And if a reviewer asks why your GLA rate is far below the market's price per square foot, the answer belongs in the narrative before they ask: they measure different things, and only the marginal rate belongs in a grid that also adjusts for site, garage and condition separately.
Doing this in DataPro360
DataPro360's GLA station runs all eight methods against every layered price basis and lays them on one dollars-per-square-foot scale, with the anchor under your control. Every basis arrives toggled on so you can see whether the rate is stable before you decide on the fully layered one.