How do I support a time adjustment with market data?
Douglas Kuss, Certified Residential Appraiser
You support a time adjustment by measuring the rate from your own closed sales rather than assuming it, and by measuring it several independent ways so you can show where those measurements agree. A single regression line is not support. Agreement between methods that work in genuinely different ways is.
Why the adjustment exists at all
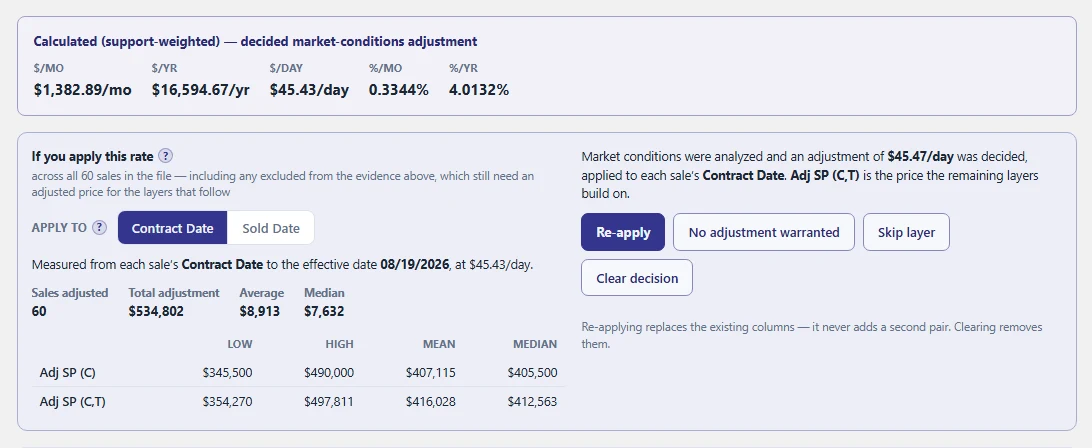
A market-conditions adjustment accounts for the change in prices between the date a comparable went under contract and the effective date of the appraisal. The contract date is the right measurement point because that is when the price was agreed — the sold date stands in only when the contract date is not available. A sale that closed a year ago in a rising market is evidence of what that property was worth then, not now, and the difference has to be measured rather than assumed.
That last word is where most reports fail review. A rate carried forward from a prior file, borrowed from a colleague, or stated without derivation is an assumption wearing the clothes of an analysis.
The methods, and why you use more than one
Each of these reads the same closed sales a different way:
- Linear regression fits a trend line through price against date.
- Theil-Sen fits a line resistant to outliers, using the median of pairwise slopes.
- Quantile regression fits the median rather than the mean, so a handful of extreme sales cannot drag it.
- Quality-adjusted regression holds size and other characteristics constant while measuring time.
- Window methods compare the median or mean of one period against another — three-month blocks, rolling windows, monthly blocks, the 1004MC periods, thirty-day windows.
- Paired sales match similar properties that sold at different times and read the difference.
- Repeat sales track the same property selling twice, which controls for the property itself.
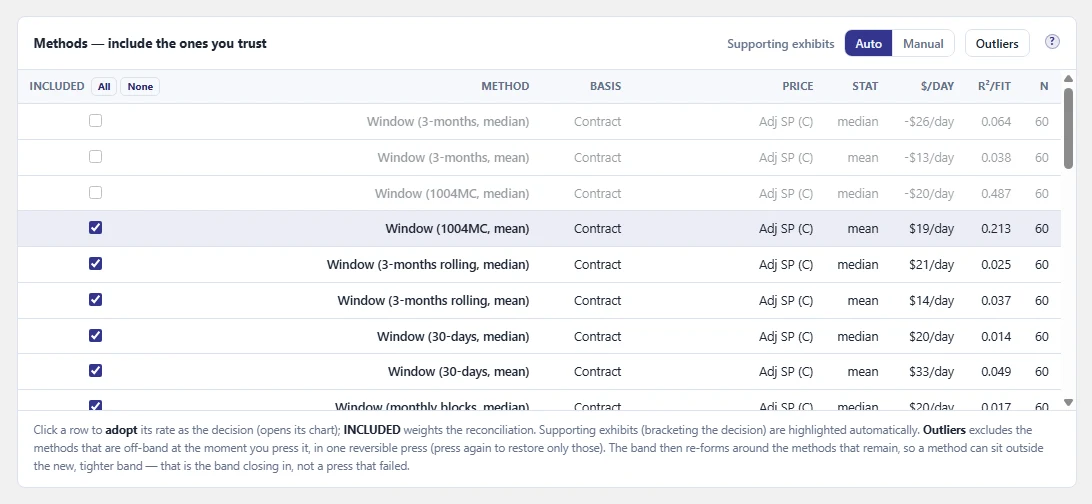
No single one is the answer. What matters is where they converge. When methods that work differently land on the same rate, that agreement is the evidence — and the spread between them is an honest statement of how certain the rate is.
You also have to decide which price you are measuring and which date. Sale price, price per square foot, and a price already net of concessions are different quantities and will indicate different rates. Contract date and sold date will too. State which you used.
What convergence looks like
Here is a worked example from a sixty-sale submarket pull.
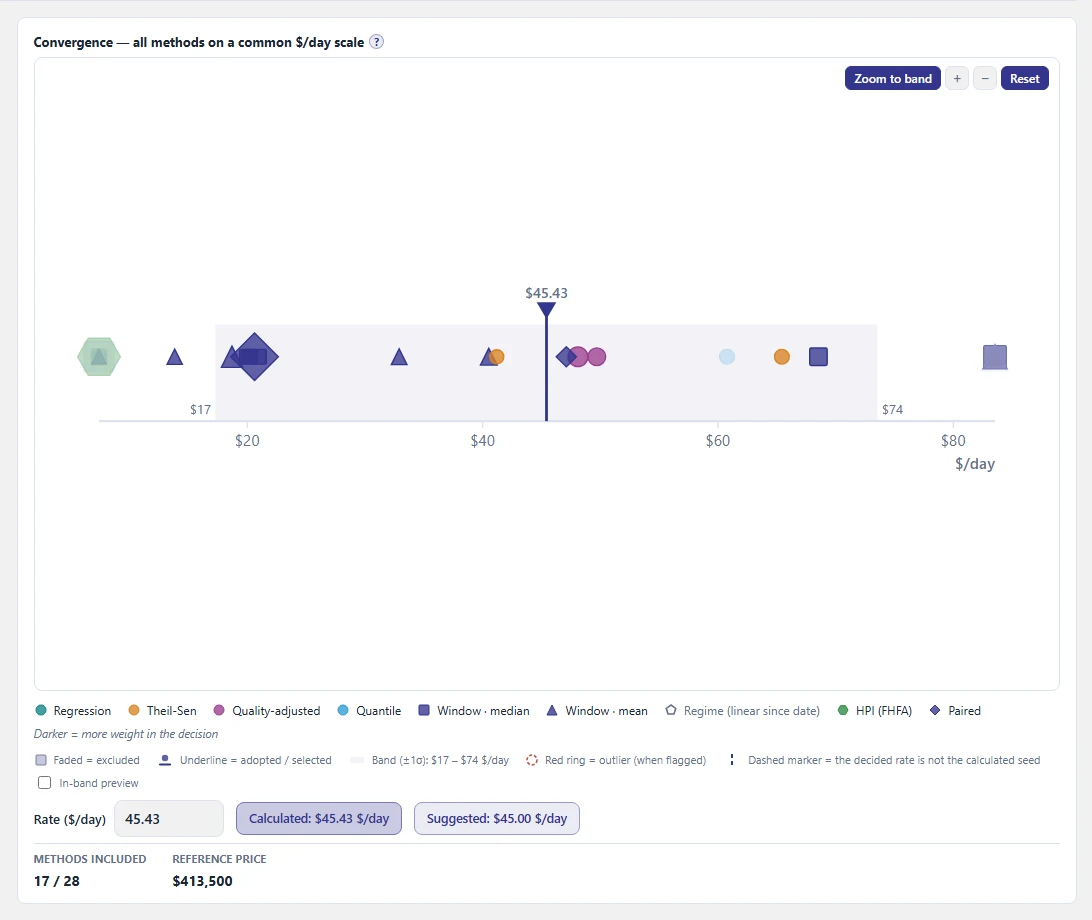
Twenty-eight indications were computed across the available methods and bases, each expressed as a common rate against a reference sale price of $413,500. The support-weighted indication came to $45.43 per day — the same rate stated as $1,382.89 per month, $16,594.67 per year, 0.3344% per month, or 4.0132% per year.
The agreement band ran $17 to $74 per day, with seventeen of the twenty-eight methods included in the decision. The methods outside the band are visible on the strip rather than hidden — a spread you can see is an honest statement of how certain the rate is.
Where the time adjustment sits in the sequence
Adjustments are not independent of one another, and the order you apply them changes the numbers.
Seller concessions come first. A concession is money that changed hands as part of the transaction, so it belongs off the price before anything else is measured. The time adjustment is then derived on the concession-adjusted price — not the raw sale price — and the reference price reflects that adjusted basis.
Time comes next because every adjustment after it is measured against prices that have already been brought to the effective date. Site size, living area and amenity adjustments are then derived on the concession-and-time-adjusted price, in that order, each layer building on the one before it.
This is the layered method, and it matters for a plain reason: if you derive a GLA adjustment from raw sale prices in a market that moved six percent over the year, part of what you are measuring as living area is actually time. The layers exist to stop one adjustment absorbing another.
What belongs in the report
At minimum: the rate you adopted, the unit it is stated in, the date basis you measured to, the price basis you measured on, how many methods you ran, how many agreed, the sample size, and the range. If you excluded methods, say which and why.
A reviewer is not asking you to be right. A reviewer is asking whether you can show the work. A rate with a stated derivation, a stated sample, and an honest band around it survives that conversation. A rate with a footnote does not.
Doing this in DataPro360
DataPro360 runs the methods above against your own MLS export automatically, on every adjustment layer, and shows where they converge. You see the support-weighted indication, the agreement band, and the count of methods inside it. You decide the rate. The program records the evidence, the methods you included, and the reasoning, and writes it into the report.
It runs in your browser, on your machine, on data you loaded yourself. There is a 30-day trial.