How do I support a pool, shop or solar adjustment?
Douglas Kuss, Certified Residential Appraiser
You support it by measuring what the market pays for the feature from your own sales — grouped comparisons, a stratified comparison, paired sales, and a cluster model that holds the other features constant — on a price that no longer carries concessions, market movement, lot size or living area. Each feature gets its own decided value at its own level; there is no single "amenities adjustment."
Why the adjustment exists at all
Amenities are what distinguish otherwise-similar homes, and they are small relative to the layers that come before them. That is precisely why they are measured last, and measured together: once the large confounders are out, solving the remaining features one at a time in sequence would make the answers depend on the sequence — whether you solve pool before solar or solar before pool would change both, and nothing about the market says which order is right. Estimated simultaneously from one common fully layered price base, each feature's value is measured with all the others held constant.
Every feature has levels, and every level is priced against a reference level set at $0 by definition. State the value the way you would say it out loud — "the third garage bay adds this much against the second" — and let the grid do the differencing between the subject's level and each comparable's.
The methods, and why you use more than one
- Grouped comparison — mean and median split the sales by feature level and read the difference between the groups; fast and legible, and sensitive to whatever else differs between the groups.
- Stratified grouped comparison makes the comparison inside strata of otherwise similar sales, so the feature is not confused with the larger-home effect that often travels with it.
- Paired sales match sales that differ on the feature and little else — the cleanest evidence there is when real pairs exist.
- Multivariate cluster coefficient fits the feature alongside the others in one model, so its value is read with the rest held constant — and it reports "not separable" rather than a number when two features move together too closely to tell apart.
- Count regressions (linear, Theil-Sen, quantile) appear for counted features — per bedroom, per bath, per garage bay. Prefer per-level over per-unit: the first bay is worth more than the second, and a per-unit rate extrapolates a straight line past what the data supports.
Run every price basis, because the pattern across bases is frequently the finding. A feature reading steady on the early bases that collapses at one layer means that layer was carrying it — the common case being a shop premium that was really acreage, gone the moment site size comes out. A traditional grid measuring against raw price would have charged for that acreage twice.
What the evidence looks like
Two reads from a sixty-sale submarket pull — deliberately two, because they show the same station behaving differently on thick and thin evidence, and neither is blended into the other.
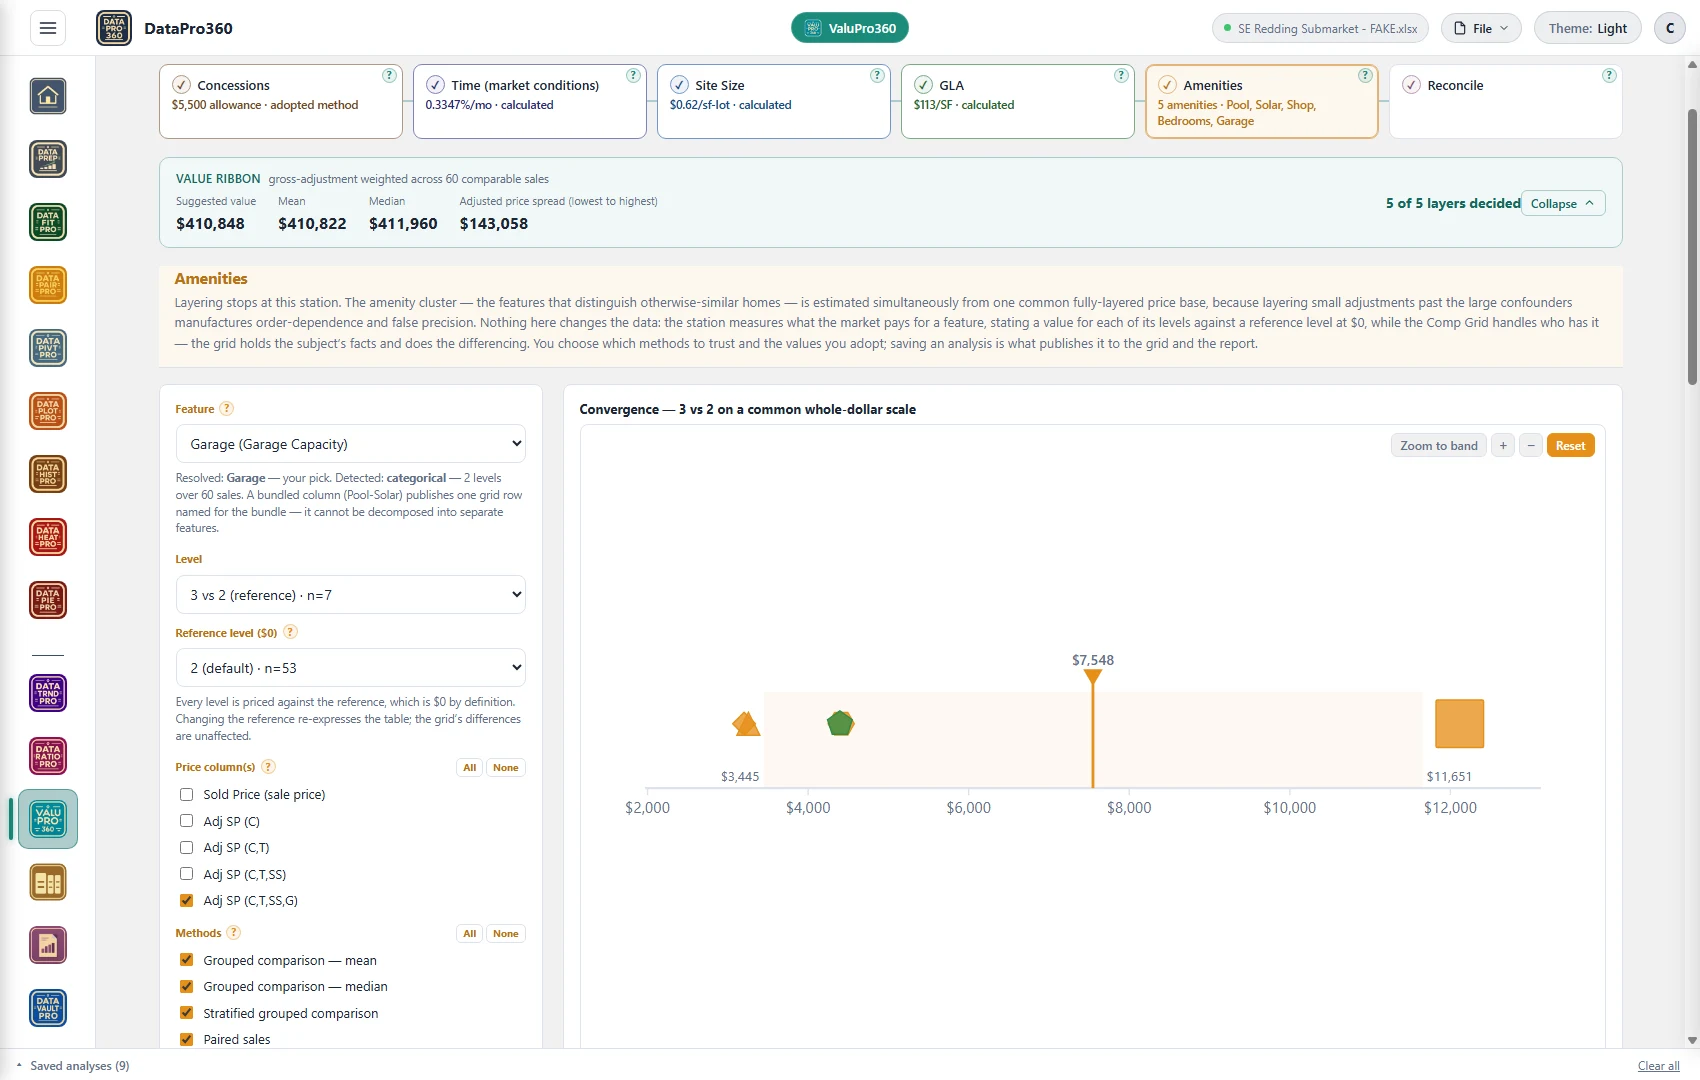
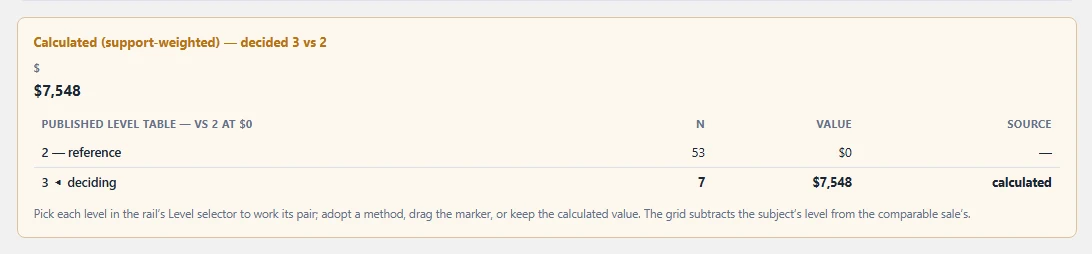
First, garage capacity, level 3 priced against a reference of 2, on the fully layered basis. The support-weighted value came to $7,548, with the band running $3,445 to $11,651 — and the published level table states the thin side plainly: 53 sales at the reference level, 7 at the deciding level. A wide band on seven sales is not a defect in the method; it is the method telling the truth about the evidence, and the report should carry that band rather than the bare number.
Second, a present-or-absent feature read on the raw sale price — before the layers come out — which is worth seeing precisely because of how it scatters. Grouped mean $23,188 and grouped median $19,000 on sixty sales; the stratified comparison at $13,061 and paired sales at $27,000, both flagged as outliers; and the cluster model reporting itself rank-deficient — at least one feature could not be separated from another on these sales, so it states no indication at all rather than a number it cannot support. A spread from thirteen to twenty-seven thousand dollars on the raw price is the confounding the layered order exists to remove, and an honest model refusing to guess is worth more than a false figure.
Where this adjustment sits in the sequence
Last of the measuring layers. Concessions, time, site size and living area are already out, so what remains between the sales is the features — which is exactly what you want to be measuring when you measure features.
What belongs in the report
Per feature: the value, the level it was priced at and the reference it was priced against, the count of sales at each level, the methods that ran and the ones you excluded, and the band. Where the model reported a feature as not separable, say so and say how you measured it instead. A thin level's n belongs next to its value, not in a drawer — a reviewer who finds it first has found something; a reviewer who was told it has nothing to find.
Doing this in DataPro360
DataPro360's Amenities station prices every feature's levels against a $0 reference on the bases you choose, states every n, flags outliers, and reports "not separable" instead of inventing a figure the model cannot support. Each feature's decided value publishes to the grid on its own row, where the differencing against the subject happens.